4 Gene Dependencies
4.1 Rationale
Following on the idea of looking for patterns in data, we set out to map genes to common functional pathways based on functional genomic data. Functional genomics is a field of molecular biology that aims to understand the function of all genes and proteins in a genome – a stated goal of much basic science research. In functional genomics, experimental strategies generally involve high-throughput, genome-wide approaches rather than a more traditional “gene-by-gene” approach.
Project Achilles is a systematic effort by the Broad Institute as part of a larger ‘DepMap’ project aimed at identifying and cataloging gene essentiality across hundreds of well-characterized cancer cell lines using highly standardized pooled genome-scale loss-of-function screens. This project uses lentiviral-based pooled RNAi or CRISPR/Cas9 libraries to systematically knock-out each gene in the genome, which allows for the stable suppression/ablation of each gene individually in a subset of cells within a pooled format allowing for genome wide interrogation of gene essentiality. Using computational modeling, a normalized value of gene essentiality is given for each gene in a single cell line. A lower score means that a gene is more likely to be essential in a given cell line. A score of -1 corresponds to the median of all common essential genes, whereas a score of 0 is equivalent to a gene that is not essential; a positive score indicates a gain in fitness and often identifies tumor suppressor genes.
It is well-known that human cancer cell lines rely on different pathways for their viability. Indeed this is the entire rationale for personalized, precision medicine in cancer. The overall goal of the ‘DepMap’ project is to identify all essential genes in 2000 cell lines over the 5-year project period to identify new therapeutic targets in various cancers. Despite not knowing the mechanistic basis for why some cell lines require specific genes while other cell lines do not, we reasoned that intrinsic reliance of a cell on a pathway might allow unbiased detection of novel genes participating in specific pathways.
Essential gene data from Project Achilles were downloaded from the DepMap portal at: depmap.org. This release contains gene essentiality scores for 18017 genes across 957 cell lines, and was used for this project.
4.2 Dependency Plots
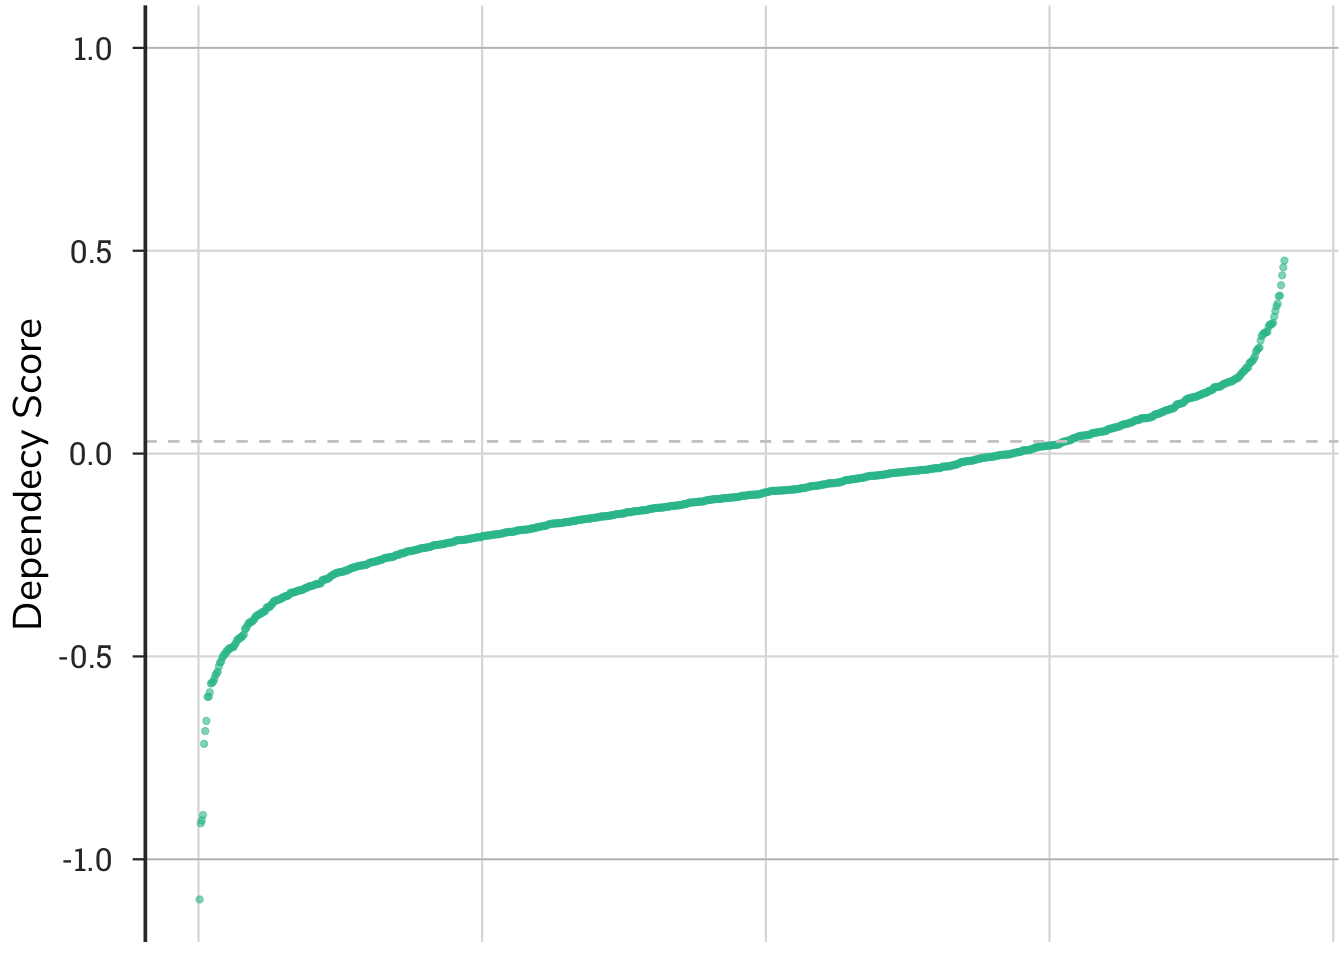
Understanding the shape of the curve and distribution of the raw data underlying the patterns is important for interpreting the results. This plot shows the distribution of dependency scores across 957 cell lines ranked from lowest (strongest dependencies) to highest (no dependency or inverse). A cell line is represented by a single point on the plot. Generally, values below -1 indicate the gene of interest (ROCK1 in this example) is essential in that cell line; values between -1 and 0, mean that cells lose fitness, but the gene is not essential; values hovering around zero indicate that ablation of ROCK1 has little effect on cell growth; values above 1, indicate that knocking-out the gene leads to a fitness advantage. In the case of ROCK1, several cells have a fitness advantage in its absence, consistent with its role as a tumor suppressor.
4.2.1 Dependency Bar Plot
4.2.2 Dependency Density Plot
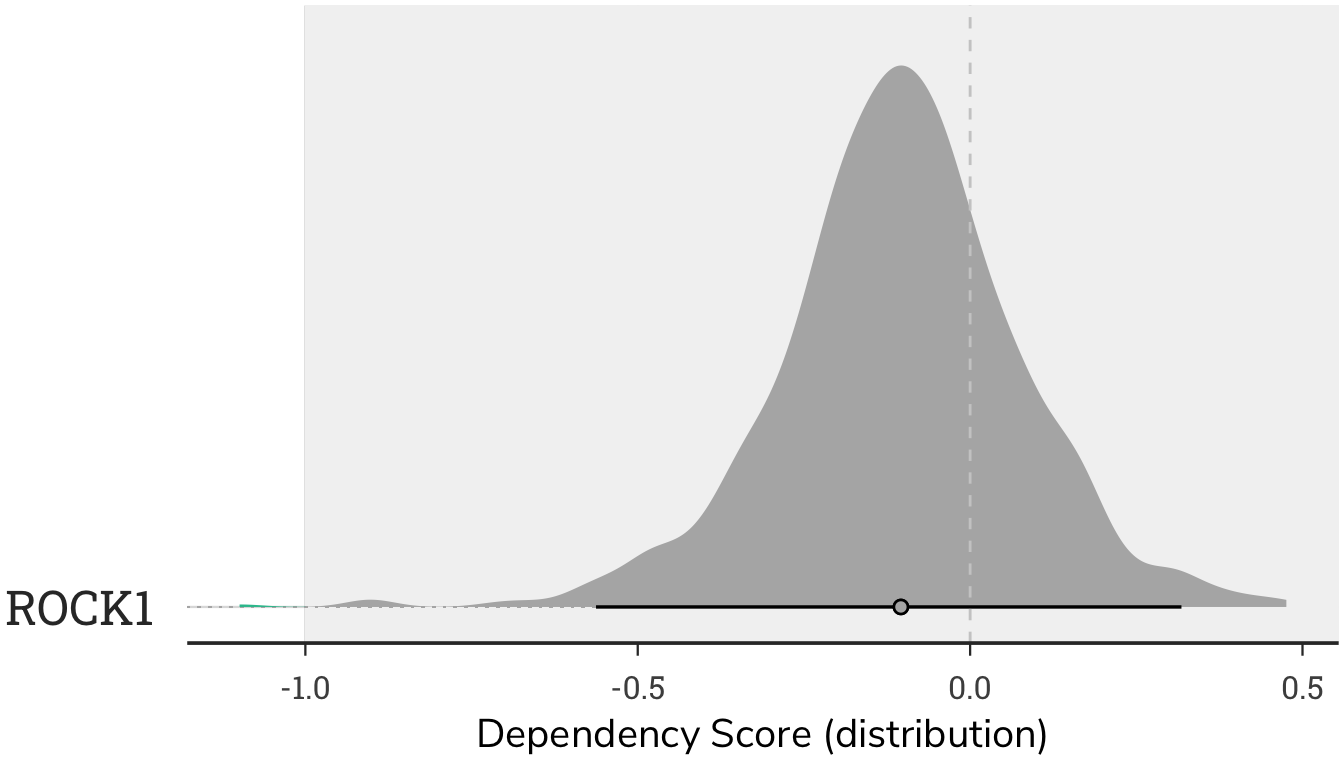
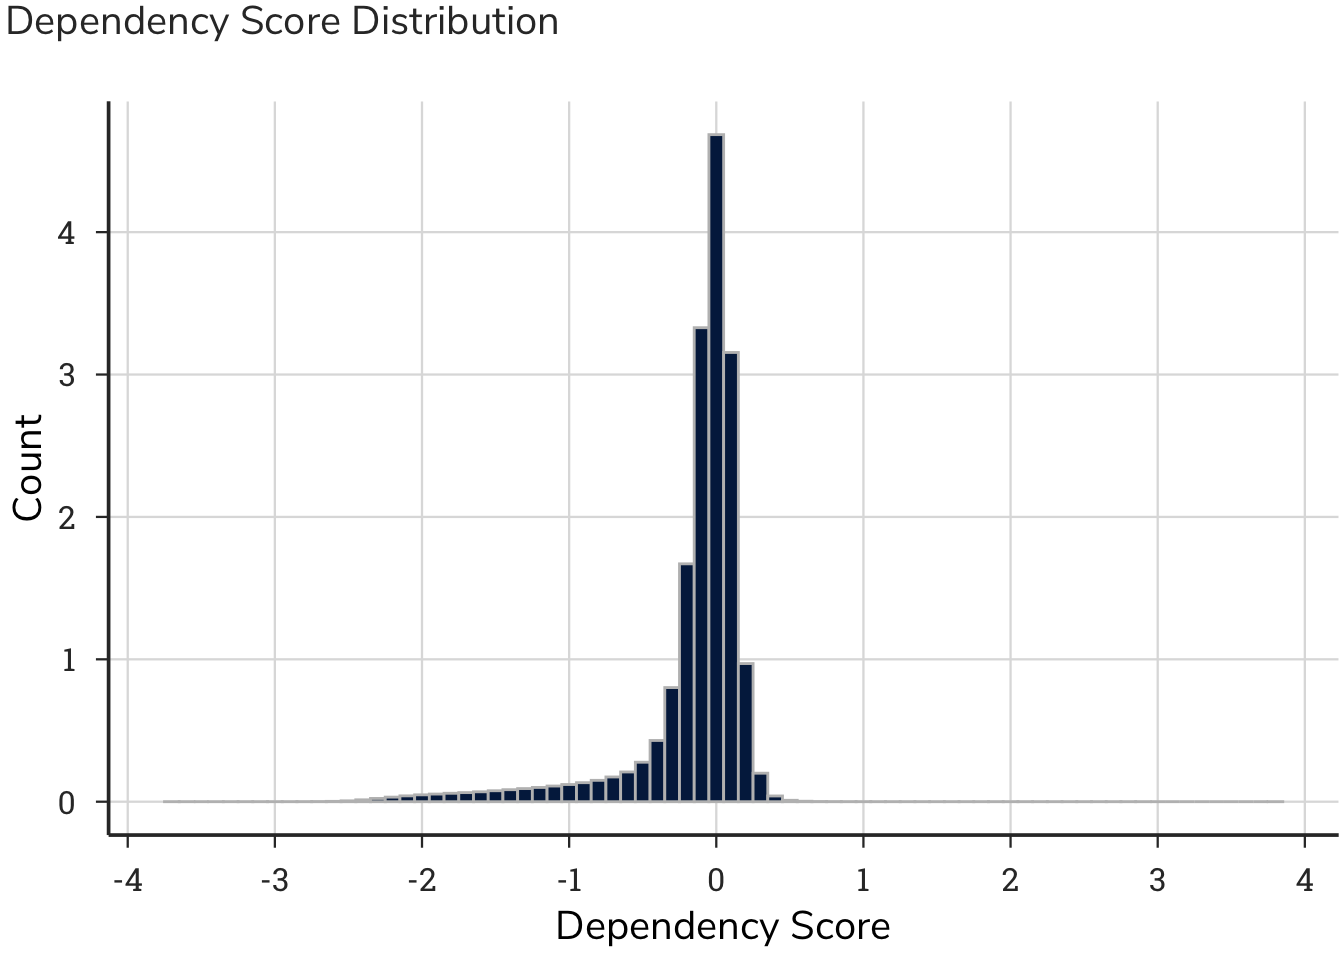
The plot is a density plot of dependency scores, showing the distribution of scores for ROCK1. While the majority of cells have little change in cellular growth when ROCK1 is absent (the density plot is centered around zero), some cells require ROCK1 for growth (cells scoring below -1), whereas in other cells ROCK1 functions as a tumor suppressor (cells with a score above 1).
4.2.3 Dependency Lineage Plot
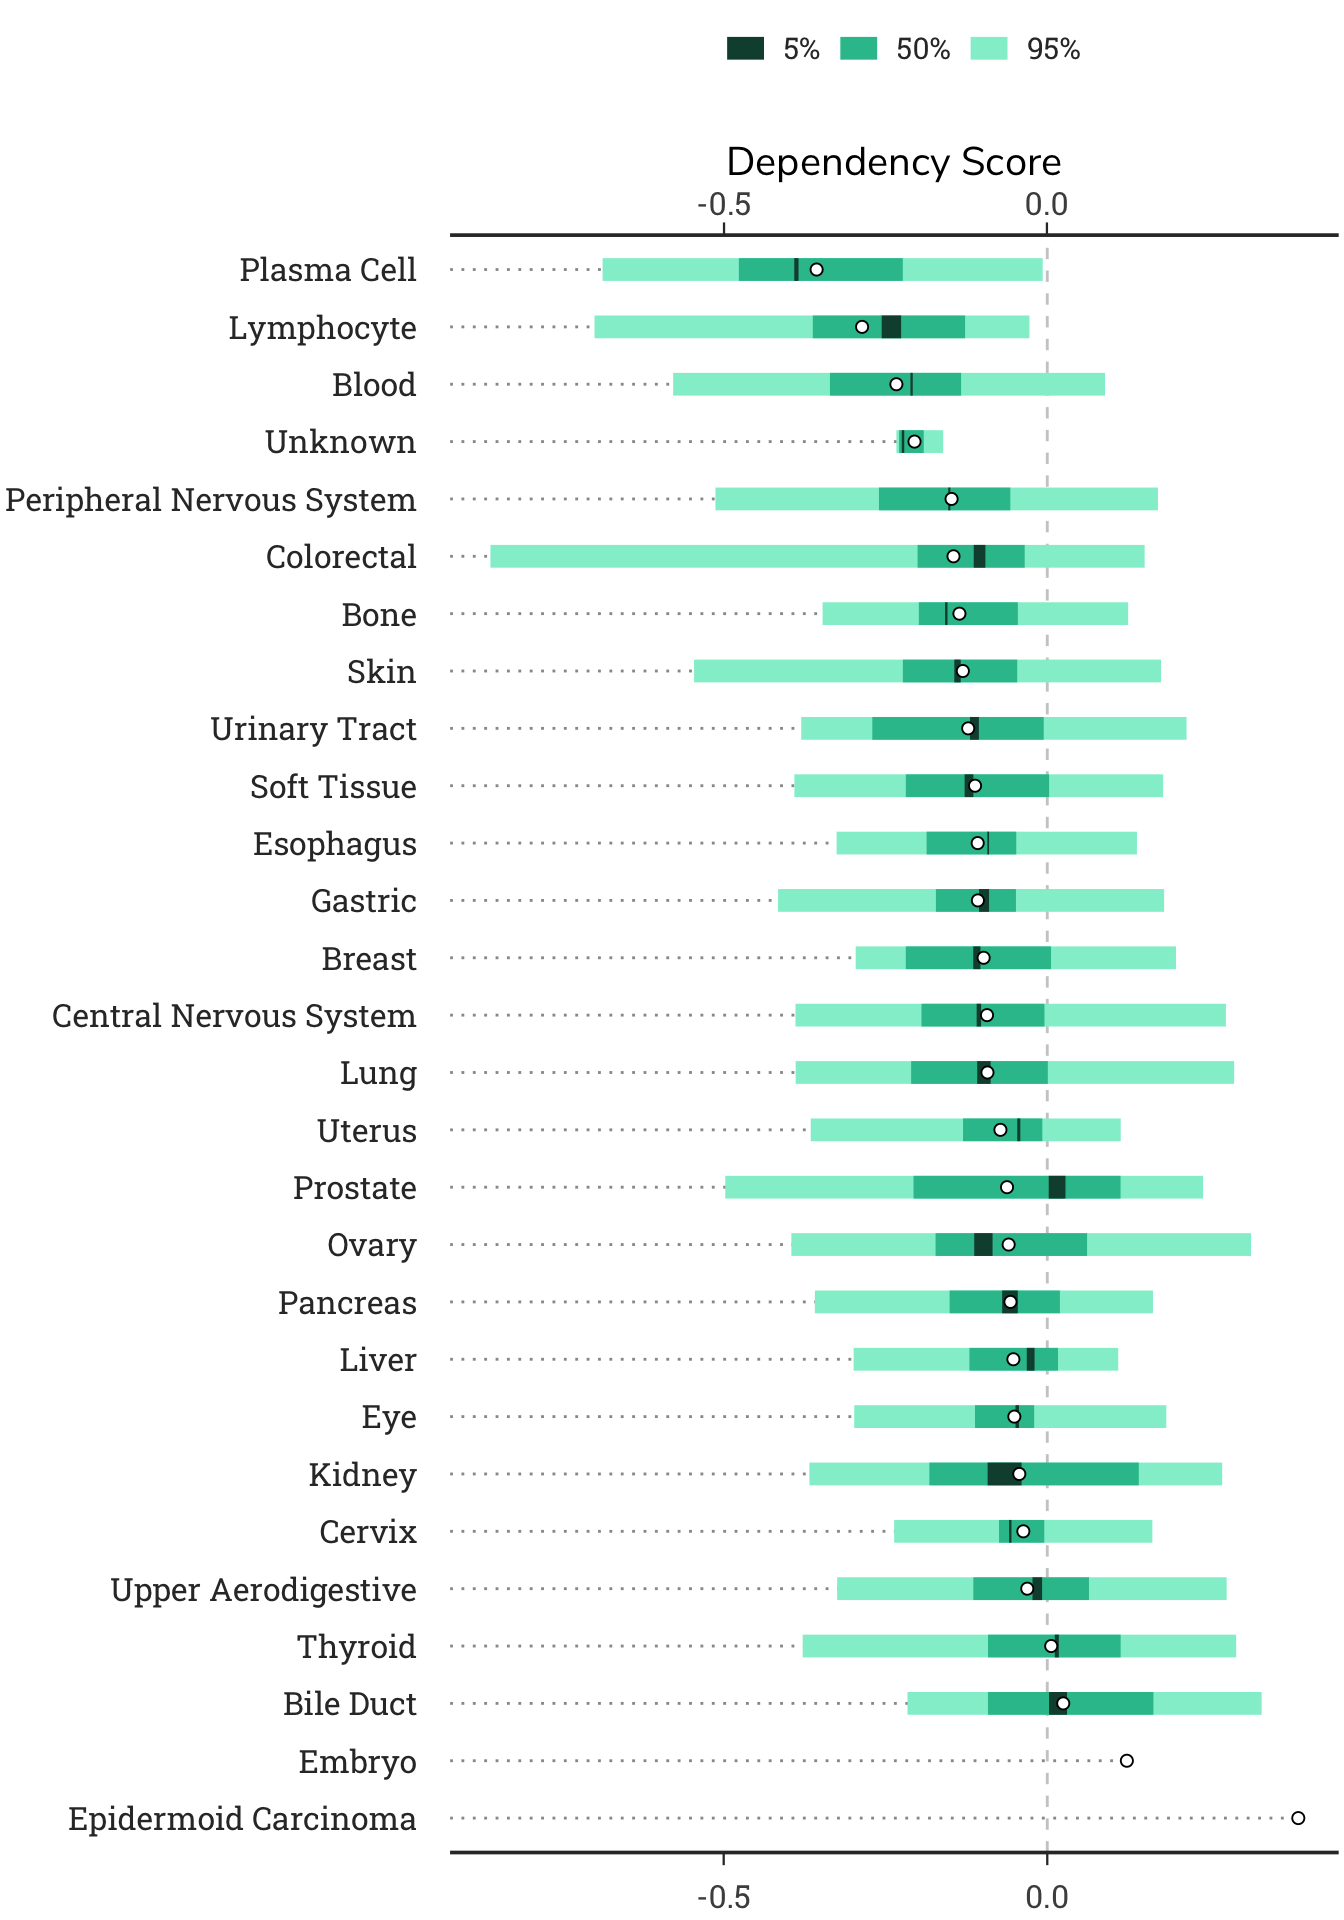
This plot shows the dependency scores group by cell lineage. In some cases, specific cell types or lineages will show consistent patterns of dependency on a gene.
4.2.4 Dependency Sublineage Plot
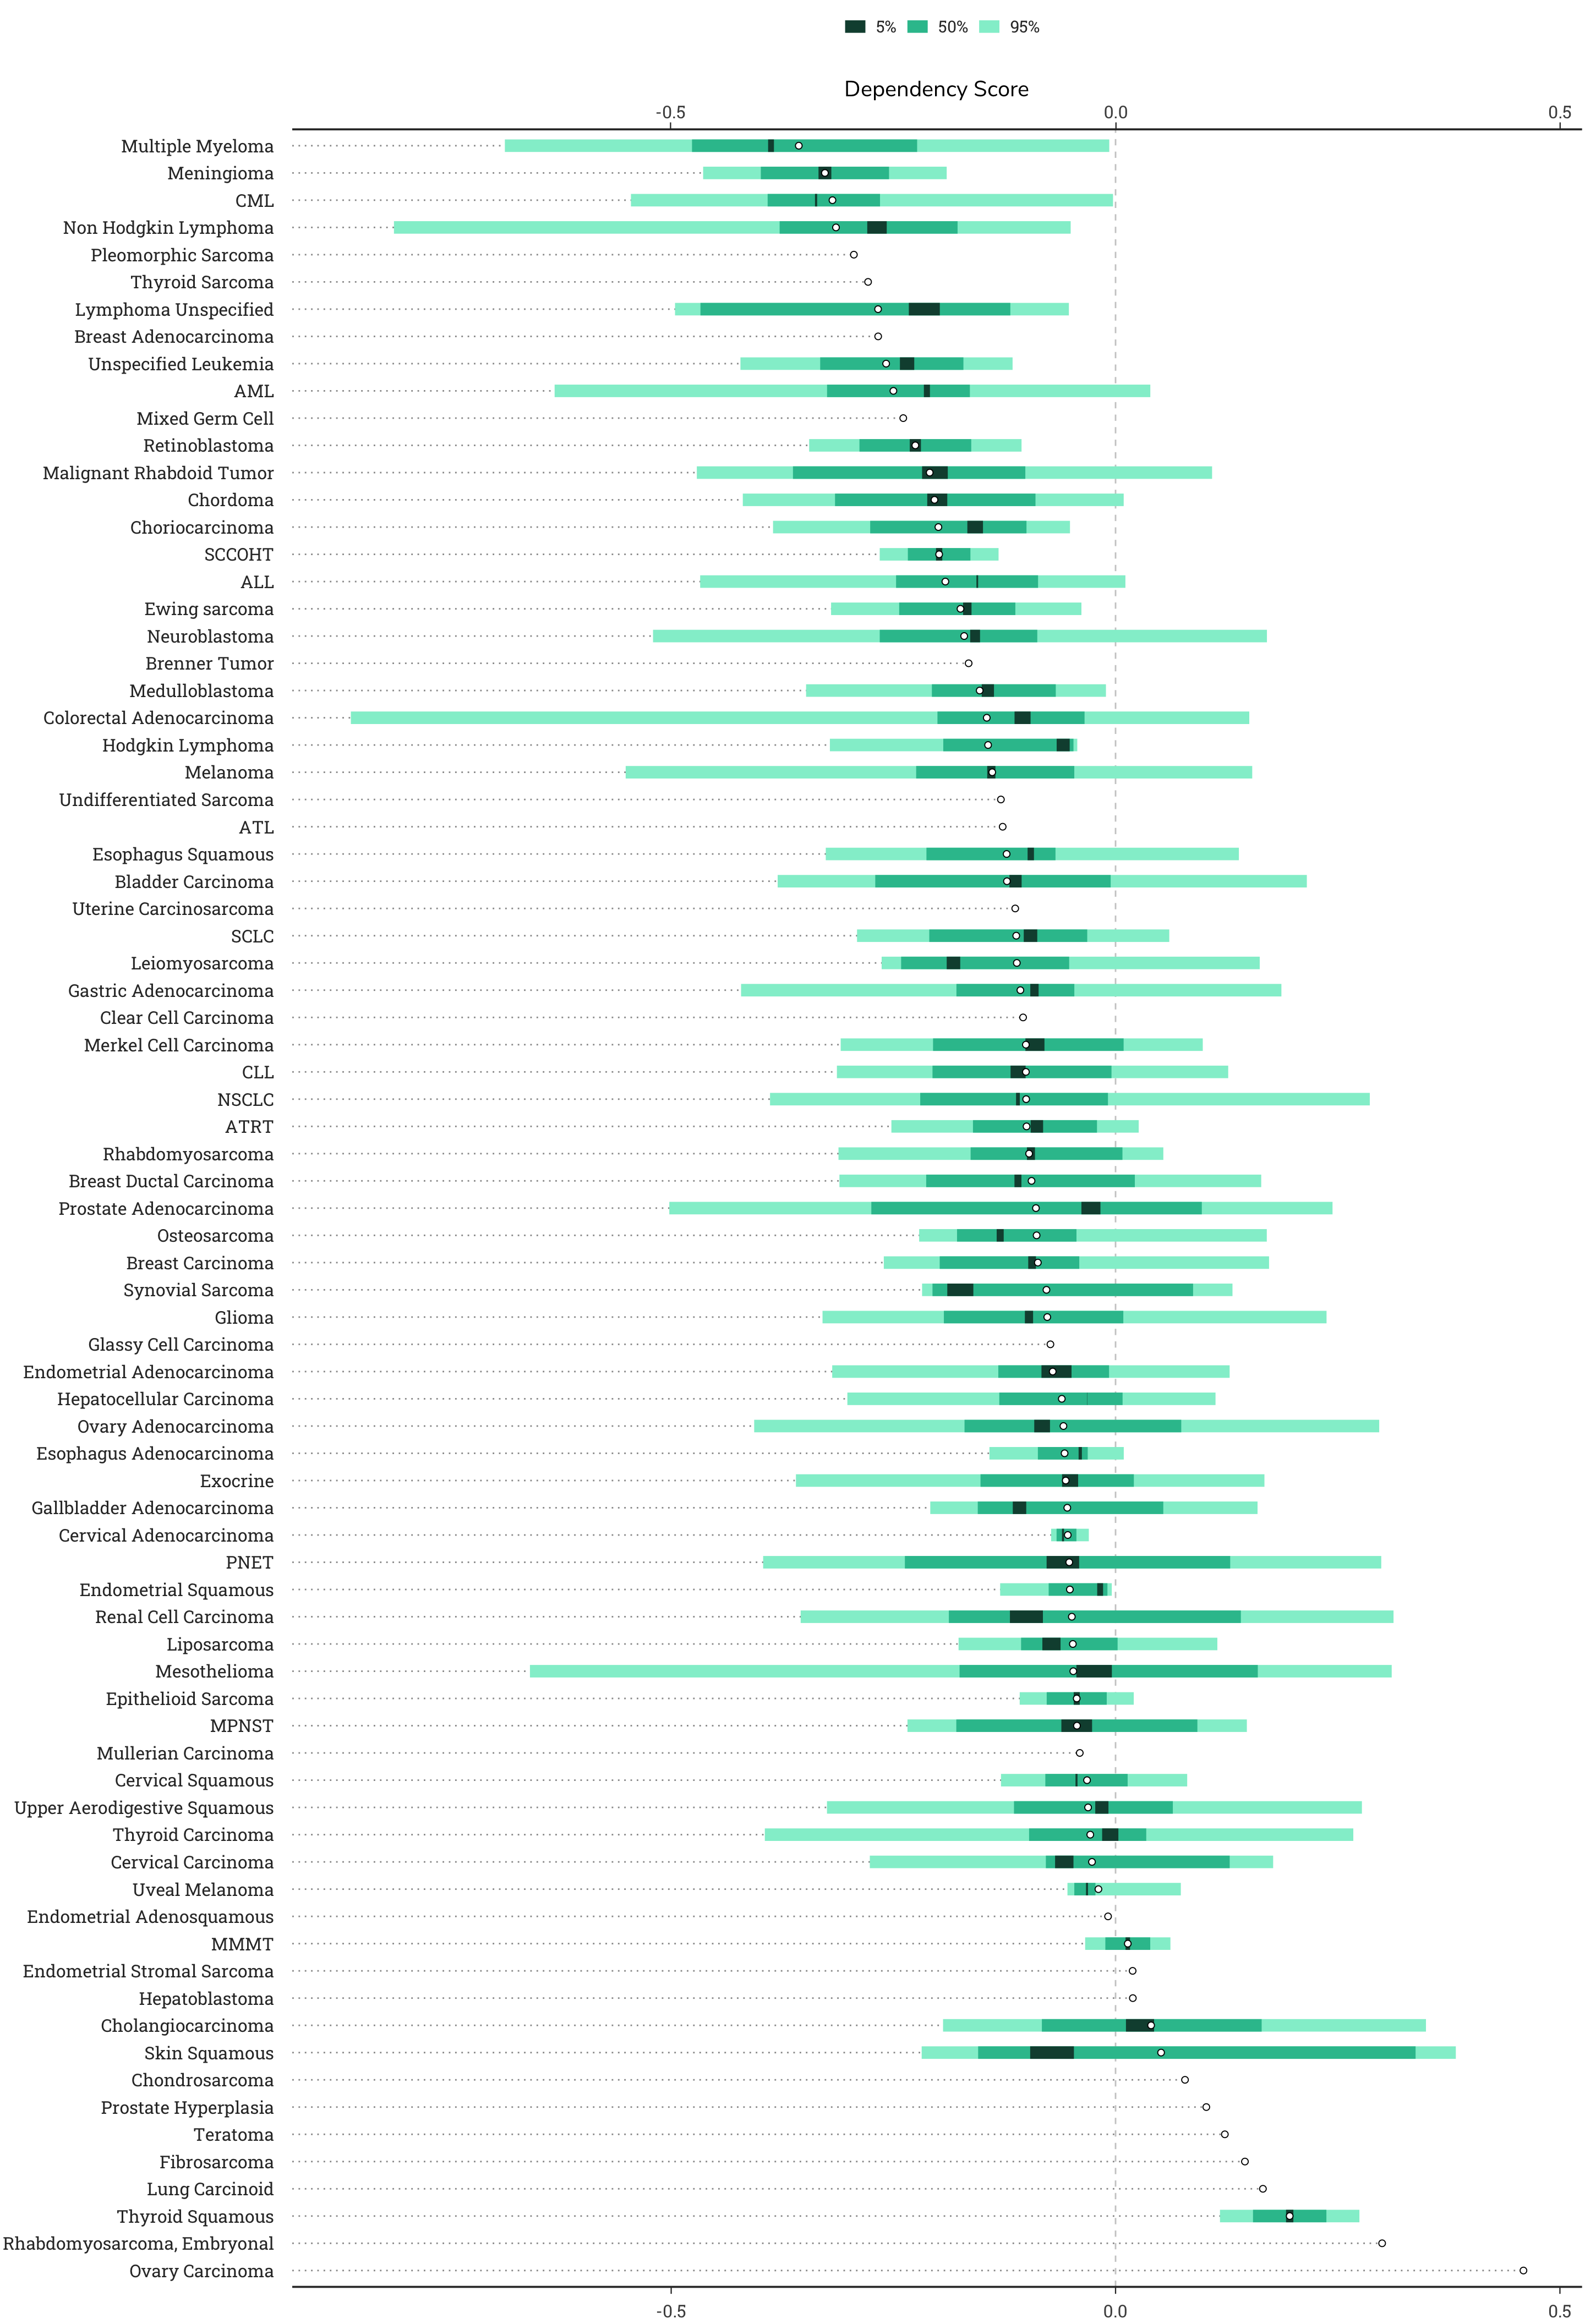
This plot shows the dependency scores group by lineage subtype (sublineage). In some cases, specific cell types or lineages will show consistent patterns of dependency on a gene.
4.2.5 Dependency Table
| Cell Line | Lineage | ROCK1 |
|---|---|---|
| A3KAW | Lymphocyte | -1.099 |
| SW948 | Colorectal | -0.911 |
| LO68 | Lung | -0.904 |
| SNUC4 | Colorectal | -0.891 |
| KMS18 | Plasma Cell | -0.715 |
| KASUMI1 | Blood | -0.684 |
| KMS20 | Plasma Cell | -0.659 |
| TL1 | Lymphocyte | -0.600 |
| OCIAML3 | Blood | -0.599 |
| HS939T | Skin | -0.588 |
| SNU16 | Gastric | -0.567 |
| MM485 | Skin | -0.565 |
A dependency table shows the ranked cells by dependency score filtered for the 12 strongest scores. To see the rest of the genes in this table, navigate back to the dependency page in DDH.
4.2.6 Expression vs. Dependency Plot
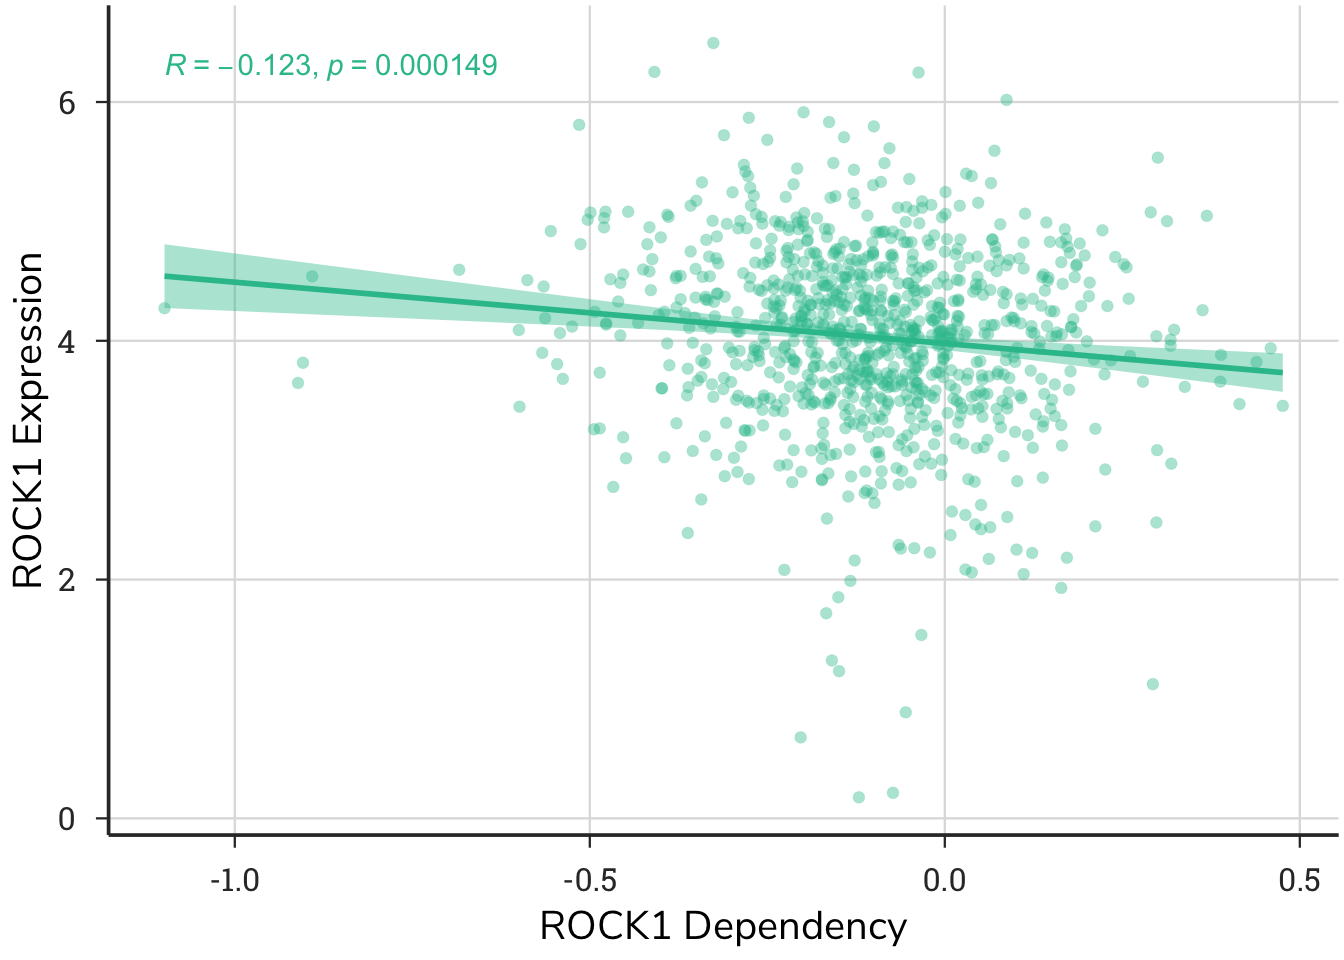
This plot shows the relationship between gene expression and gene dependency in the same cell lines. Each point represents a single cell line and it’s corresponding expression and dependency score.
4.3 Co-essentiality
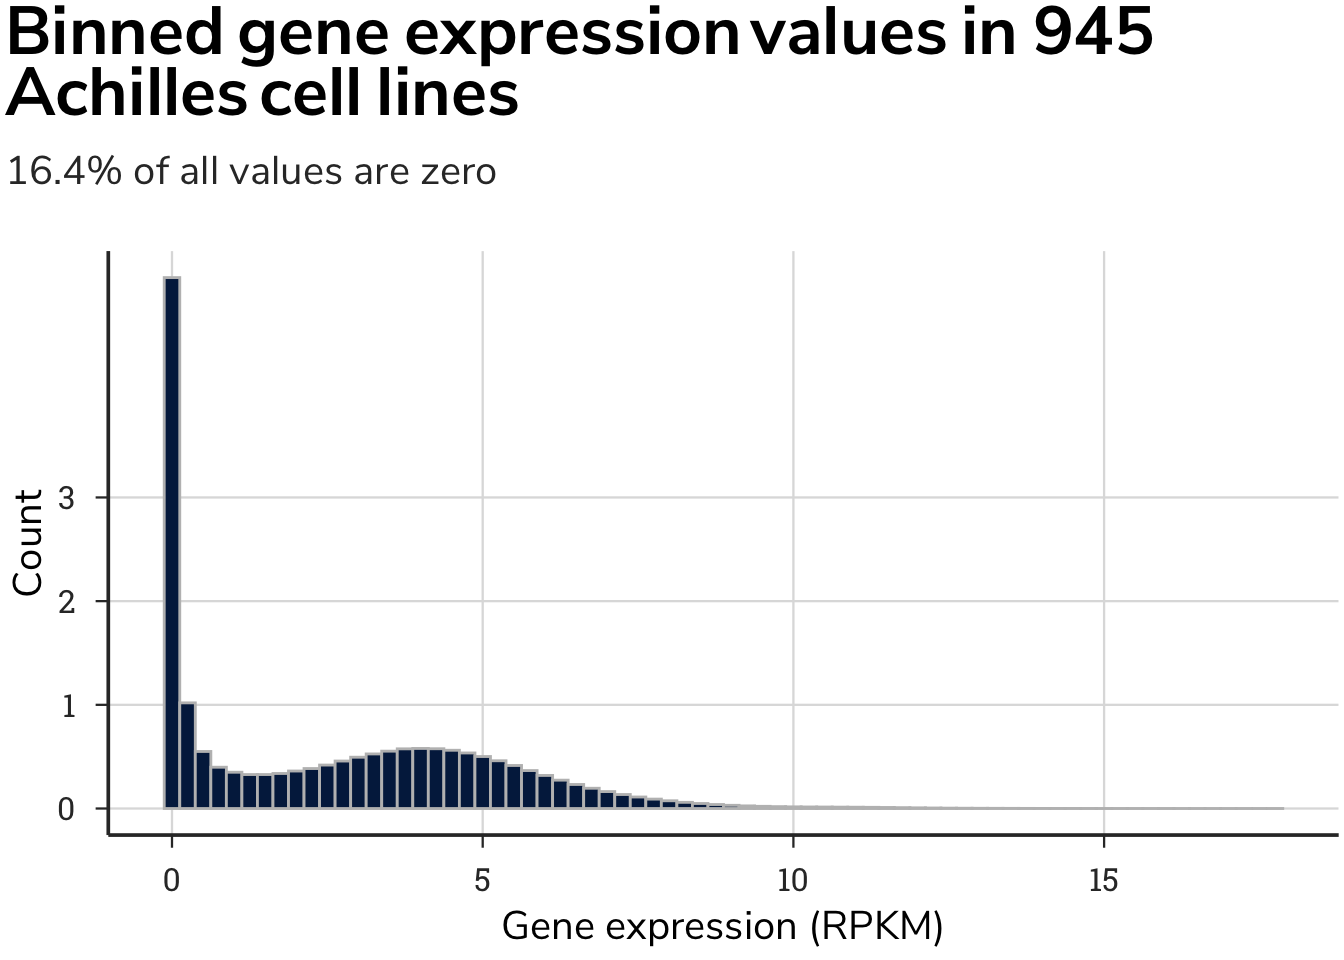
To find patterns in gene dependencies across cell lines, we generated a Pearson correlation matrix of all genes by all genes. This analysis generated gene-gene correlation values that matched values published on depmap.org, validating the first step in our analysis. High levels of gene expression are often thought to be indicative of key genes for a given cell type. Thus, we next compared dependency values to gene expression values. The Cancer Cell Line Encyclopedia project is a collaboration between the Broad Institute, and the Novartis Institutes for Biomedical Research and its Genomics Institute of the Novartis Research Foundation, which together conduct detailed genetic and pharmacologic characterization of a large panel of human cancer models. As of the most recent CCLE release, 1043 cell lines have been characterized for gene expression. In DepMap, 945 of the 957 cell lines have gene expression data. Using these two datasets, we compared the essentiality of a gene to its expression value.
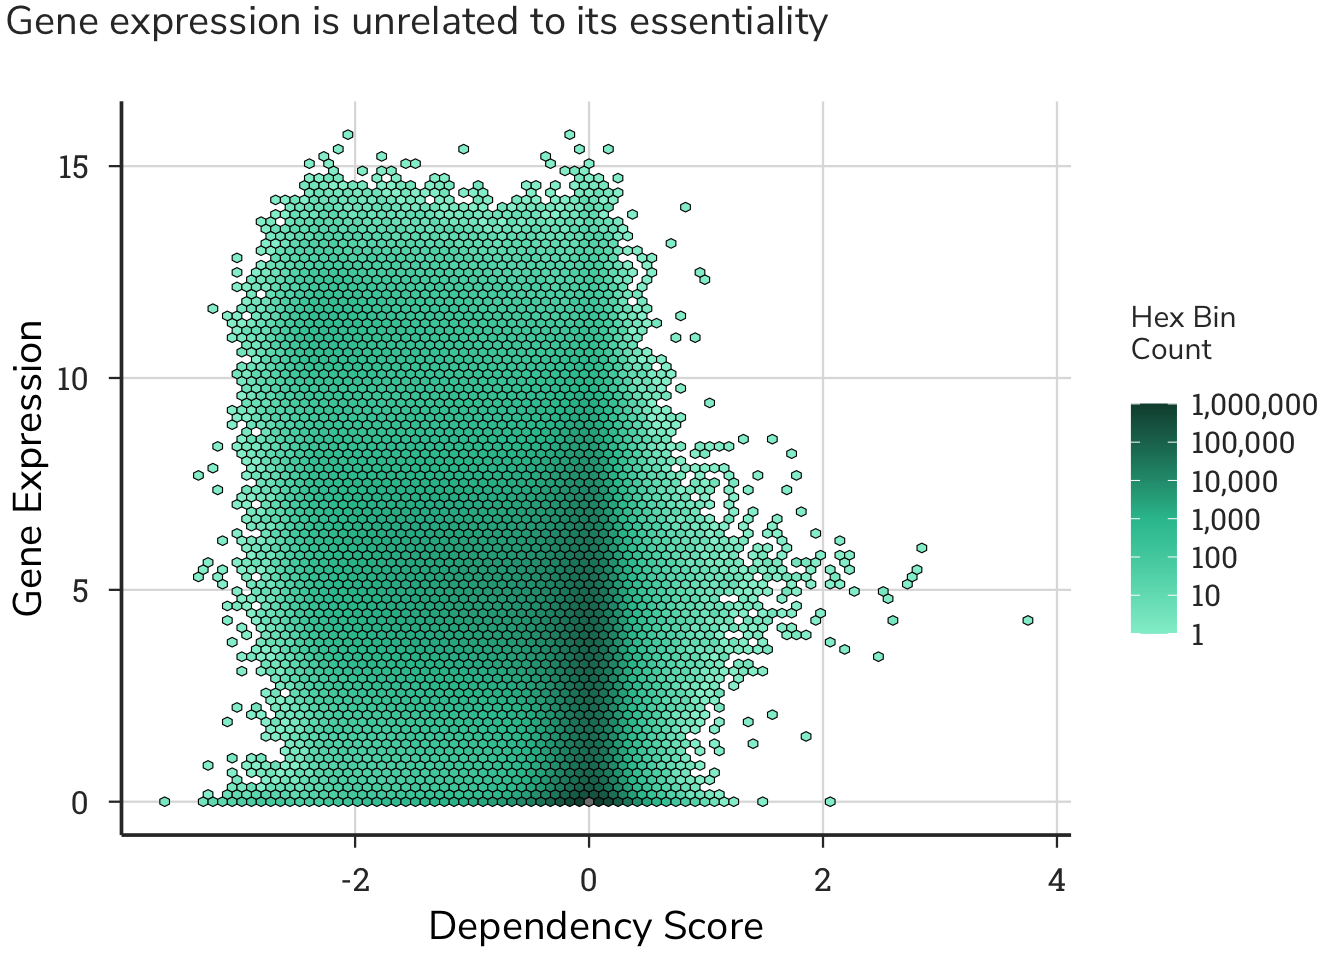
We predicted a V-shaped curve, with stronger dependencies as gene expression increases. Surprisingly, we saw no relationship between gene expression and gene essentiality, where genes with both low and high expression displayed both gains and losses in fitness. The overall observation from this dataset shows baseline gene expression levels are poor indicators of the essentiality of a gene. This analysis also highlighted that several genes were binned on the x-axis, i.e. could have no measurable expression levels, but have assigned dependency scores. Across 957 cell lines in the Achilles project, 16.4% of all gene expression values are zero, confirming this notion.
4.3.1 Data Processing
Given cells do not express all genes, but might receive a dependency score in this experimental paradigm, we sought to remove dependency scores for gene-cell line pairs that have an expression value of zero under basal conditions. Of the 957 cell lines for which gene essentiality data is collected, 945 have genome-wide gene expression data. From these cell lines, we removed dependency scores for genes from cell line that have a corresponding gene expression value of zero.
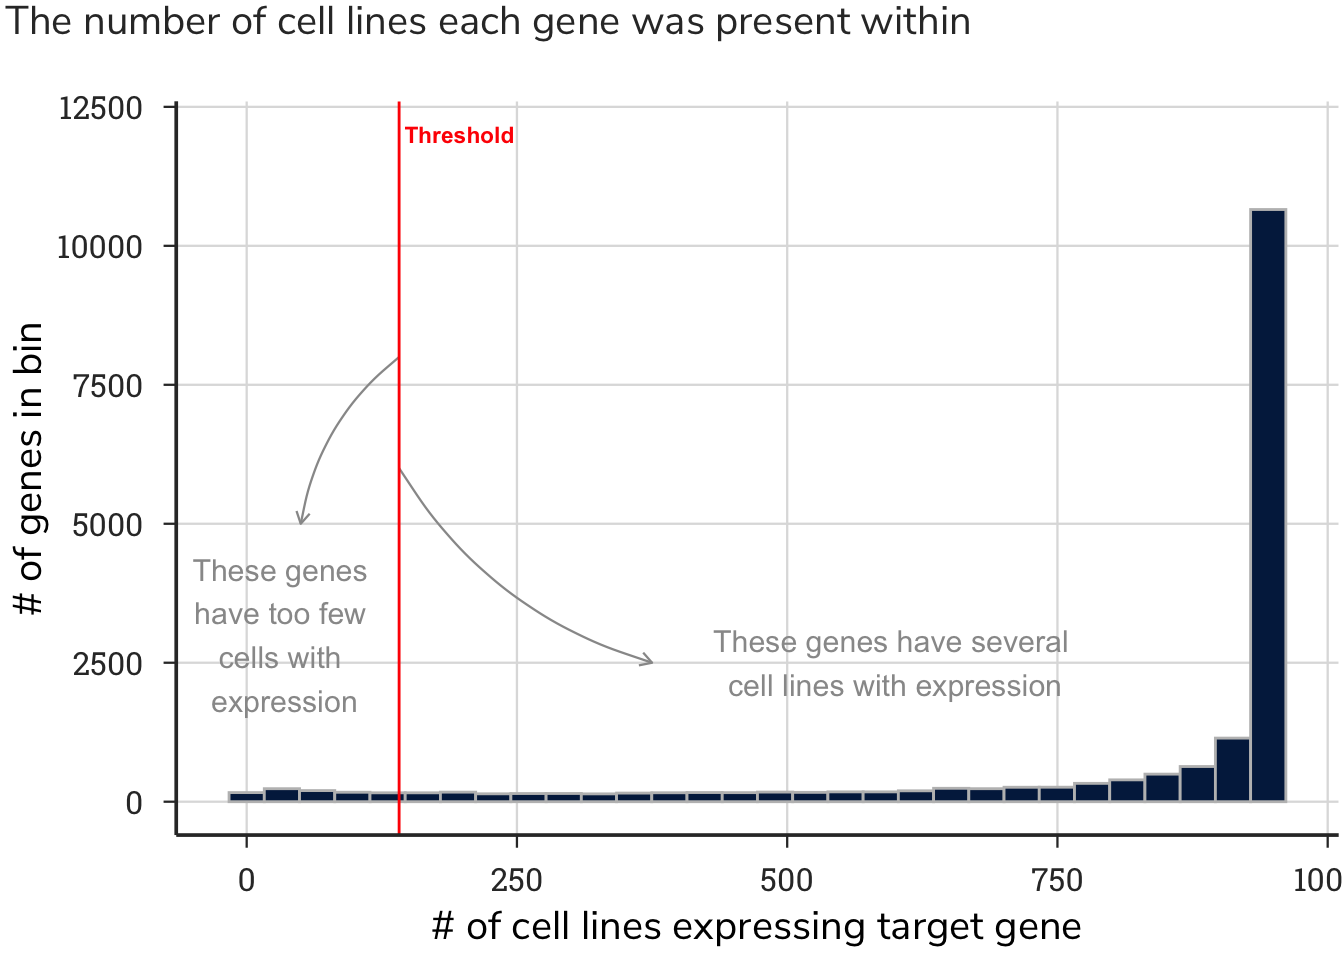
For some genes expressed in highly specific and restricted cell types, this operation removed many dependency values. After removing these values, we found that highly specialized genes in discrete cell types have too few cells with both gene expression values and gene essentiality values to assign a meaningful correlation value. Thus, if a gene was absent from too many cell lines, we omitted it to prevent assigned values from relying on too few data points.
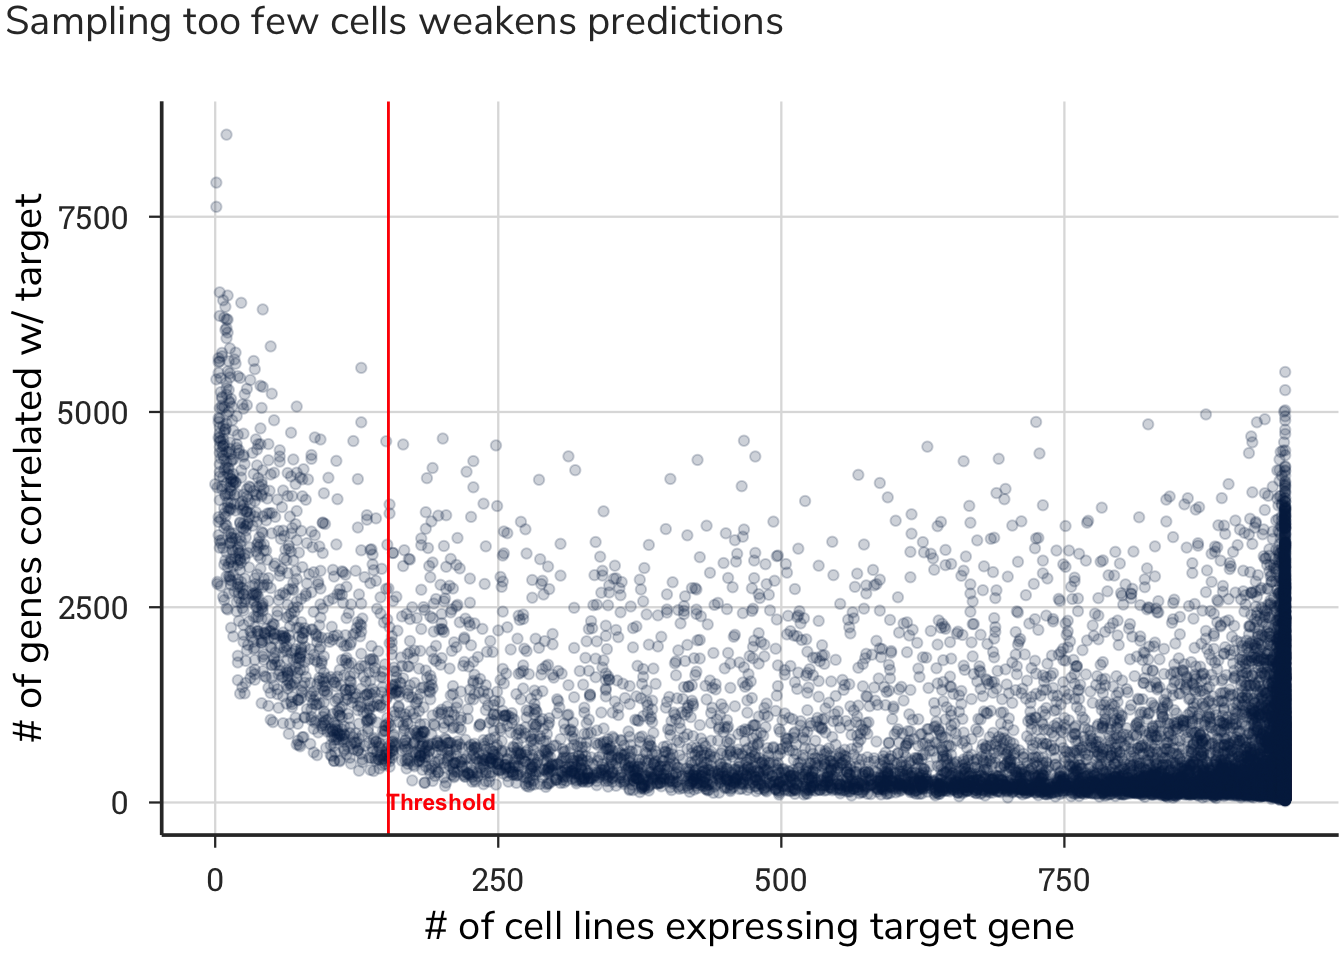
We set a threshold of no more than 804 zeros, meaning that if a gene had fewer than 153 cell lines with dependency values, the correlation pattern of a gene would be meaningless, and that gene was therefore removed. This value was based on removing 5 % of the genes with the fewest number of cells deriving the correlation value and having the highest number of correlated gene patterns. This process removed 900 genes that had too few cells with expression and dependency data.
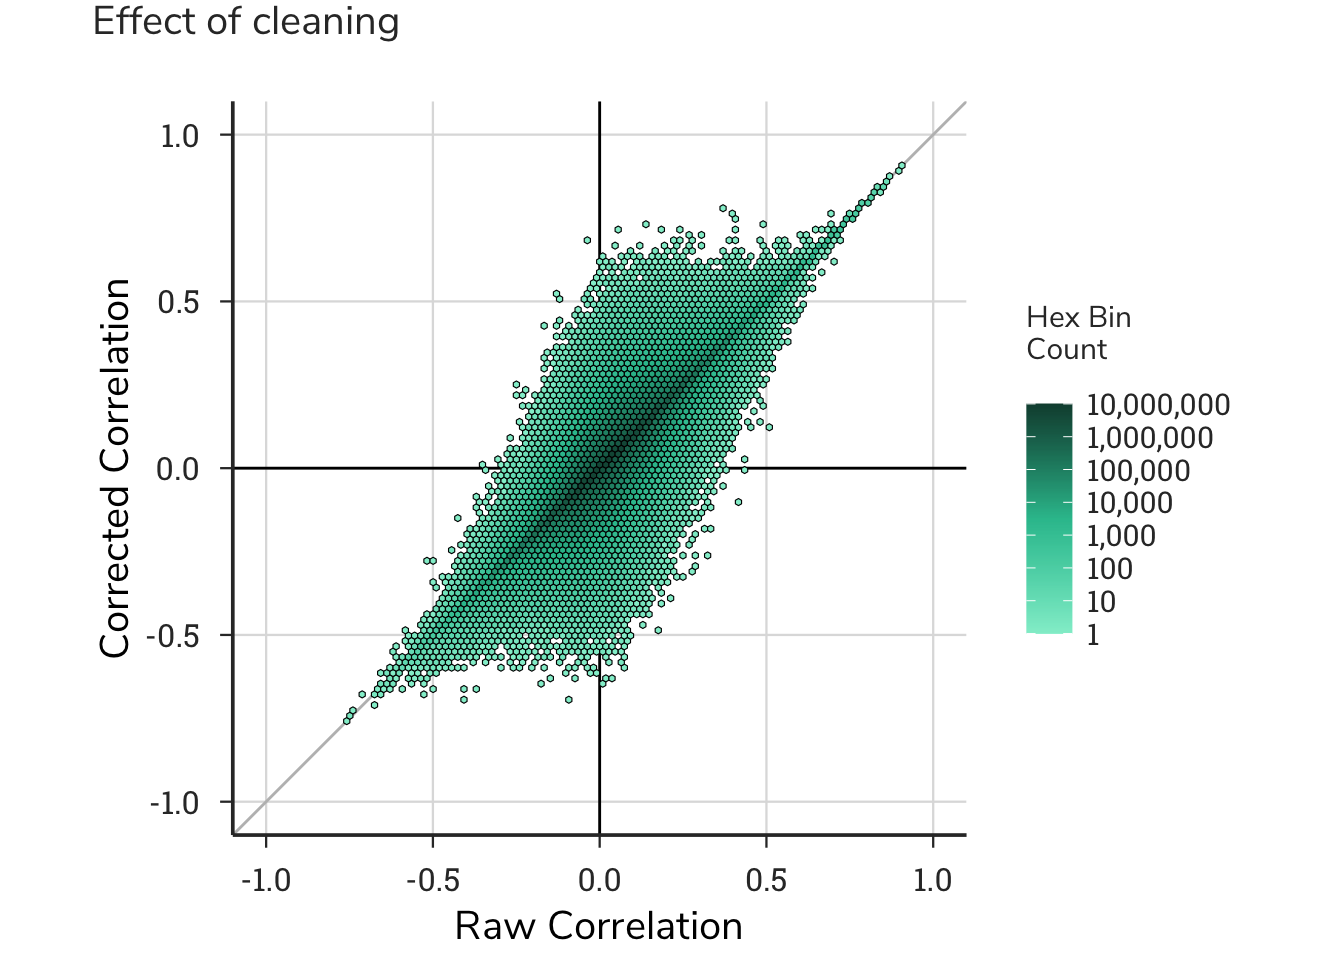
To quantify the effect of these cleaning step on the data, we compared the correlation matrix generated from the raw data to the correlation matrix from the cleaned data. Plotting these ~200M gene-gene pairs revealed that more positive genes became more positive compared positive genes that became negative; conversely, more gene pairs with negative correlations became more negative rather than less negative. Simply stated, these cleaning steps had a greater effect on strengthening the data in either direction rather than weakening it, supporting these steps as important for this resource. These ‘cleaned’ dependency data had 17118 remaining gene-dependency pairs, which were then used to generate correlation matrix.
4.3.2 Positive Correlations
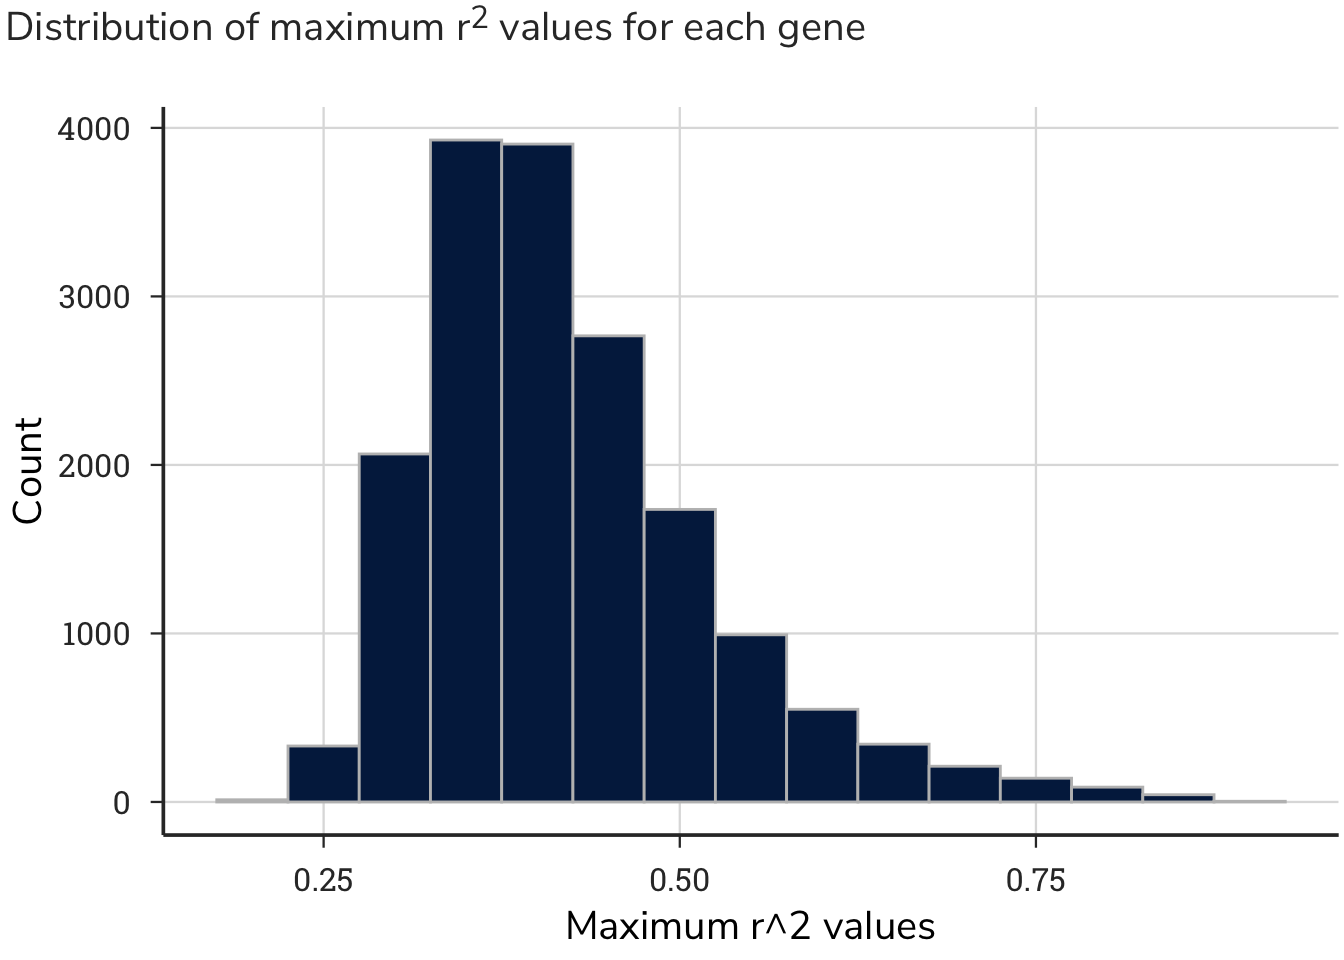
To identify genes that shared similar patterns of essentiality with other genes, thereby placing genes in functional pathways, we generated a gene-by-gene Pearson correlation matrix on these prioritized data to quantify the similarity in dependency patterns and annotate genes in functional pathways.
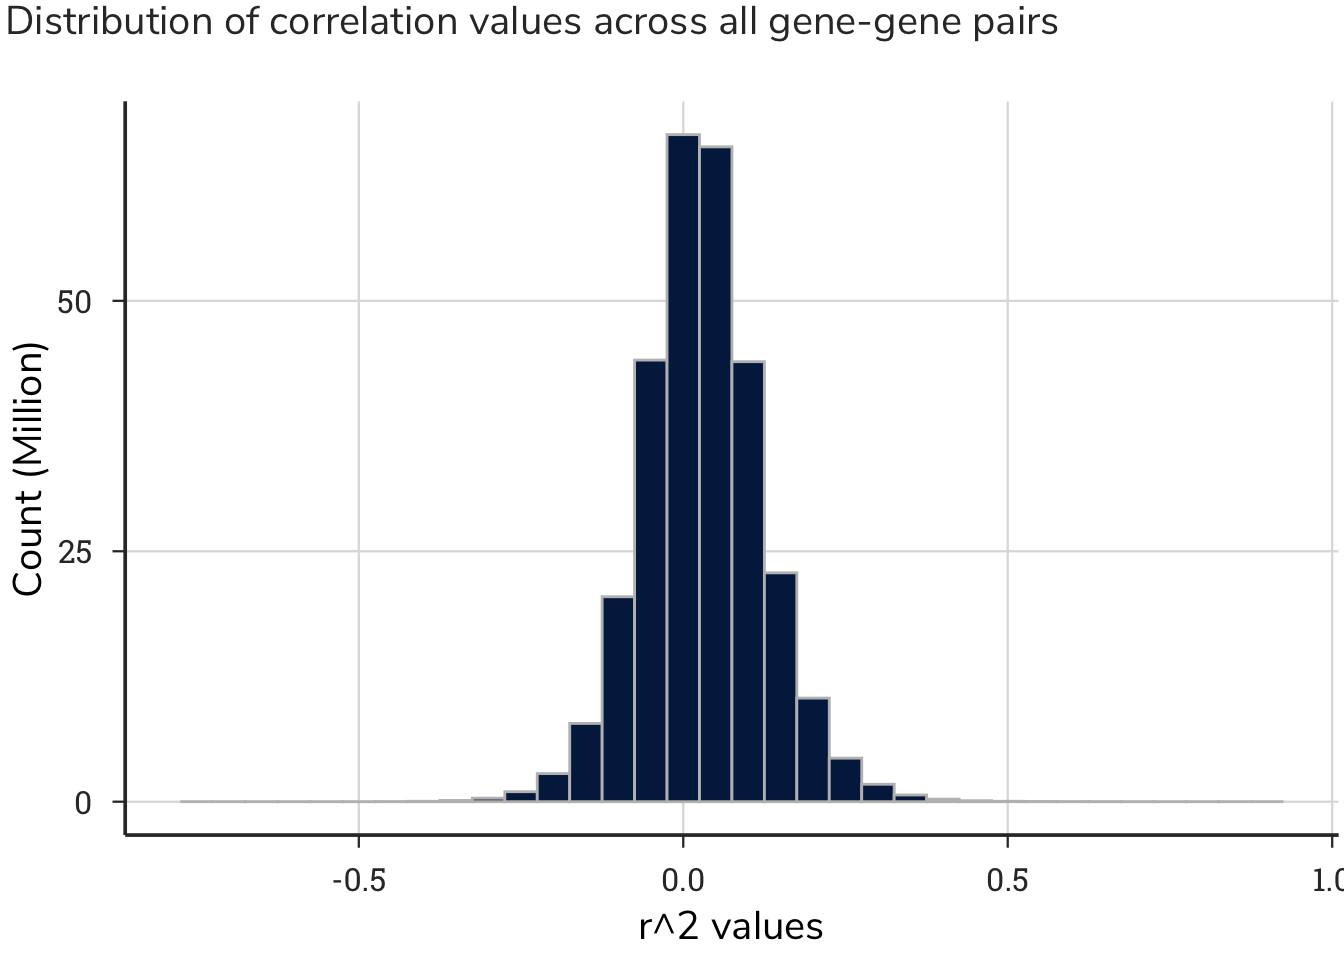
This process generated approximately 293 million correlation values, with a distribution centered around zero. This output produced a range of maximum correlation values for each gene.
4.3.2.1 Statistics
Rather than setting an arbitrary threshold for the r^2 value that would be considered a low, medium, or high correlation between two genes, we performed a permutation test on the correlated data. A permutation test involves permuting one or more variables in a data set before performing the test, in order to break any existing relationships and simulate the null hypothesis. In this case, we broke the relationship between gene-gene pairs and the correlation values. We then generated a distribution of null statistics (fake means), along with standard deviations of these sampled data. This strategy identified at which correlation value to draw a threshold of a “significant correlation” for these analyses. We sampled 20,000 r^2 values from all gene-gene pairs without replacement simulating a virtual Achilles correlation dataset for a single cell. We then repeated this process 1000 times mimicking 1000 discrete cell lines.
This statistical analysis produced the following data:
Mean: 0.0299912
Standard Deviation: 0.0928719
Using a standard deviation threshold of 2, we calculated the boundaries of r^2 values to be greater than 0.22 or lower than -0.16 for negative correlations. Simply stated, gene-gene correlations above or below, respectively, these values were considered strong and used for subsequent analyses. The r^2 values and corresponding z-score transformations of these values are shown on the tables.
4.3.3 Comparing To Known Literature
The process of generating a prioritized gene list based on similar patterns to a query gene is an unbiased approach to map genes into functional pathways. To find novel genes in established pathways, this approach requires identifying “novel” or “unexpected” genes in the gene list. However, what may seem unexpected to one researcher might be obvious or intuitive to another. To remove bias in prioritizing candidate genes for further study and to programatically identify novelty, we generated a co-publication index, where every human gene was compared to publication co-incidence with every other human gene in the PubMed database.
PubMed contains 30 million publication records containing article metadata and abstracts. We began by first parsing each of the 30 million abstracts for all gene names and gene aliases in an abstract. Next we were able to generate article level summaries for each gene in each article, and then counted gene-gene co-occurrence in an abstract. Measuring all human gene-gene co-occurrences across all PubMed records allowed us to identify the frequency with which a gene was published with another gene. Unfortunately, gene nomenclature is a mess, with official gene names changing over time, and several genes sharing common aliases. As a keystone example, the protein p38 has been used as a name to describe the genes MAPK14 (NCBI gene id 1432), AHSA1 (NCBI gene id 10598), and AIMP2 (NCBI gene id 7965). The protein p38 associated with MAPK14 is among the most studied and published on genes in the human genome, whereas AHSA1 and AIMP2 are among the least studied. This discrepancy and ambiguity in identifying genes in abstracts necessitated an alternative approach.
Next, we leveraged a PubMed resource from the National Library of Medicine (NLM) called gene2pubmed that links unique NCBI gene ids to a PubMed id. This resource is part of the NLM’s Indexing Initiative (IND) is working to automate indexing methods partially or completely manual indexing practices. Using gene2pubmed, we again measured all human gene-gene co-occurrences across all PubMed records. While this method overcomes the challenges associated with gene nomenclature by providing gene ids, it is still limited in its ability to curate genes associated with scientific papers by the same challenges in gene nomenclature.
A new machine learning (ML)-based resource developed by the Computational Biology Branch at the NLM/NCBI called Pubtator aims to overcome these challenges by providing automatic annotations of biomedical concepts such as genes and mutations in PubMed abstracts and PMC full-text articles. Using advanced text-mining techniques, Pubtator goes beyond assigning genes to paper by developing a ML model that generates automated annotations for genes/proteins, genetic variants, diseases, chemicals, species and cell lines in a single paper, across all PubMed (30 million) abstracts and the PMC Text Mining subset of (3 million full text) articles.Improved concept identification systems and a new disambiguation module based on deep learning provides best-in-class annotation accuracy. Using these data, we filtered “concept ids” that matched official NCBI gene IDs, and then took the same approach described above to determine the number of times a gene was annotated with scientific paper, and the pairwise count of each gene with each other gene in a single paper, across all papers. Because of the wide range of annotated gene co-occurrences, we also generated a relative index [(co-occurrence count/max co-occurrence)*100] normalized to 100. The co-occurrence count and co-occurrence index provides useful, and unbiased information about the level of prior knowledge for gene-gene relationship identified by the analytic approach detailed above.
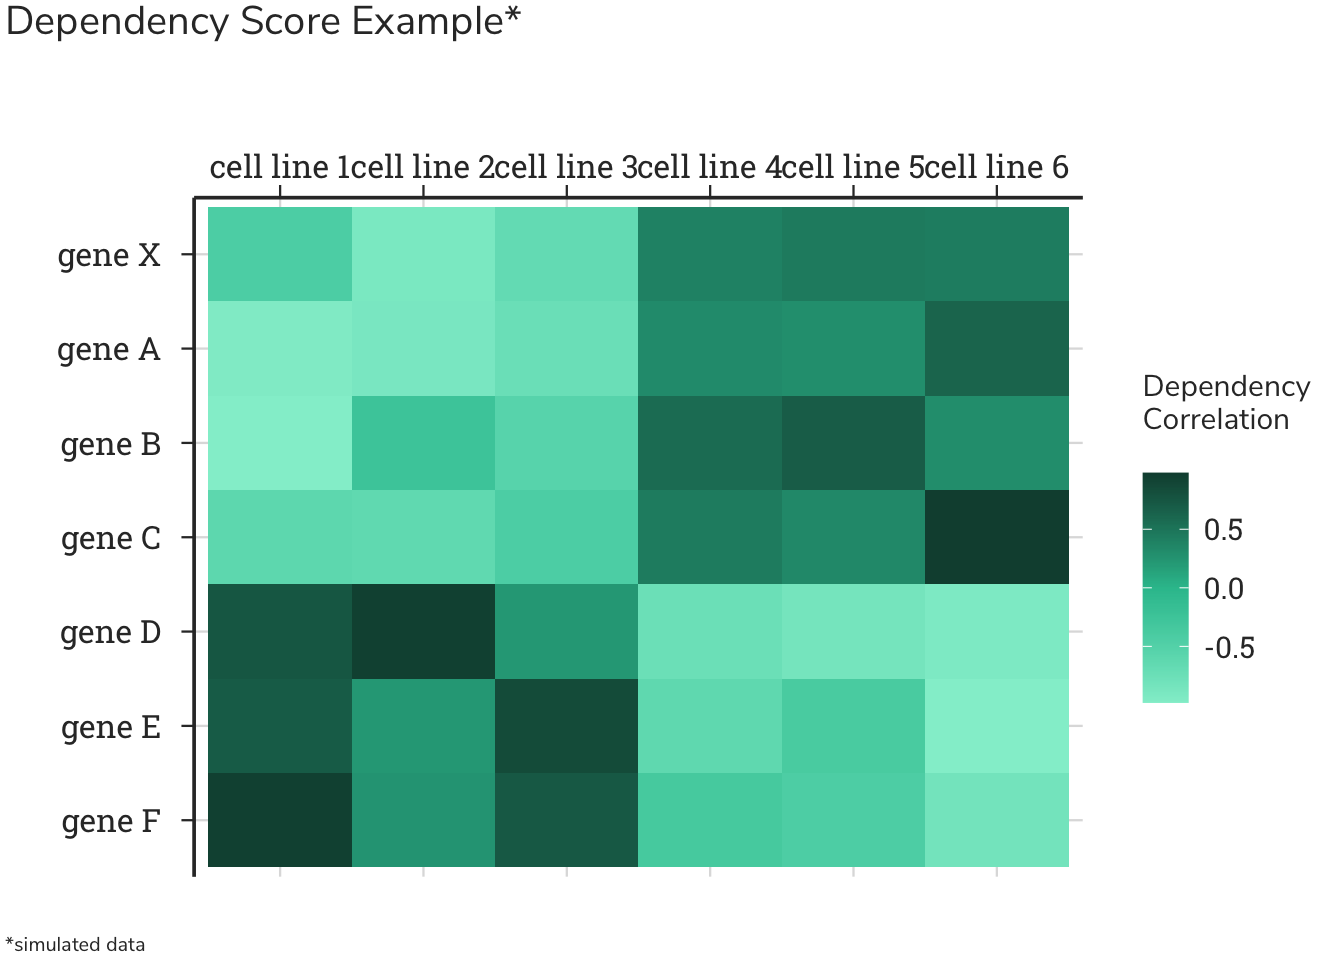
Positive correlations of dependency scores are ranked for each gene. Recall that these genes show similar patterns of dependencies in the same cell lines. More simply, the cells that care about ROCK1 deletion also care about deletion of these genes, implying a functional relationship. In the Dependency Score Example heatmap schematic above, ROCK1 is gene X, and genes with similar patterns would be genes A, B, and C. The genes that show a similar genetic dependencies as ROCK1 and are above 2 standard deviations away from the resampled mean are displayed.
One data source that can help prioritize genes for study is to compare gene-gene associations to known gene-gene relationships based on previous literature.
| Symbol | Gene Name | Z-score | Co-Publication Count |
|---|---|---|---|
| ROCK2 | Rho associated coiled-coil containing protein kinase 2 | 5.2 | 1544 |
| PAWR | Pro-apoptotic wt1 regulator | 4.3 | 19 |
| DAPK3 | Death associated protein kinase 3 | 4.3 | 77 |
| LUZP1 | Leucine zipper protein 1 | 3.9 | 7 |
| TMOD3 | Tropomodulin 3 | 3.8 | 8 |
| STK17B | Serine/threonine kinase 17b | 3.7 | 15 |
| ATP1B3 | Atpase na+/k+ transporting subunit beta 3 | 3.0 | 7 |
| PSMA8 | Proteasome 20s subunit alpha 8 | 2.9 | 2 |
| NUAK2 | Nuak family kinase 2 | 2.8 | 10 |
| SLC17A4 | Solute carrier family 17 member 4 | 2.8 | 2 |
| PEDS1 | Plasmanylethanolamine desaturase 1 | 2.8 | 5 |
| H2AZ1 | H2a.z variant histone 1 | 2.7 | 9 |
| STK17A | Serine/threonine kinase 17a | 2.7 | 6 |
| CIB4 | Calcium and integrin binding family member 4 | 2.6 | 2 |
| IFNA8 | Interferon alpha 8 | 2.6 | 5 |
| EP300 | E1a binding protein p300 | 2.6 | 238 |
| TMCO1 | Transmembrane and coiled-coil domains 1 | 2.6 | 1 |
| PDCD10 | Programmed cell death 10 | 2.6 | 26 |
| TAF5L | Tata-box binding protein associated factor 5 like | 2.6 | 4 |
| LRRFIP2 | Lrr binding flii interacting protein 2 | 2.6 | 7 |
| KDM4C | Lysine demethylase 4c | 2.5 | 20 |
| TCF3 | Transcription factor 3 | 2.5 | 74 |
| IRF4 | Interferon regulatory factor 4 | 2.5 | 49 |
| PRDM1 | Pr/set domain 1 | 2.5 | 43 |
| OR2H1 | Olfactory receptor family 2 subfamily h member 1 | 2.5 | 0 |
| PROSER2 | Proline and serine rich 2 | 2.5 | 1 |
| TAOK2 | Tao kinase 2 | 2.5 | 15 |
| EPHA2 | Eph receptor a2 | 2.4 | 103 |
| OTOR | Otoraplin | 2.4 | 0 |
| LGALS14 | Galectin 14 | 2.4 | 4 |
| MYB | Myb proto-oncogene, transcription factor | 2.4 | 79 |
| SH3GL1 | Sh3 domain containing grb2 like 1, endophilin a2 | 2.4 | 12 |
| MANF | Mesencephalic astrocyte derived neurotrophic factor | 2.4 | 7 |
| DSC1 | Desmocollin 1 | 2.4 | 7 |
| SLC25A22 | Solute carrier family 25 member 22 | 2.4 | 8 |
| SDHD | Succinate dehydrogenase complex subunit d | 2.4 | 10 |
| PRRG3 | Proline rich and gla domain 3 | 2.4 | 2 |
| DSG1 | Desmoglein 1 | 2.3 | 14 |
| HPGDS | Hematopoietic prostaglandin d synthase | 2.3 | 4 |
| NCOA1 | Nuclear receptor coactivator 1 | 2.3 | 22 |
| C1orf43 | Chromosome 1 open reading frame 43 | 2.3 | 3 |
| YWHAG | Tyrosine 3-monooxygenase/tryptophan 5-monooxygenase activation protein gamma | 2.3 | 29 |
| TADA1 | Transcriptional adaptor 1 | 2.3 | 6 |
| TAOK1 | Tao kinase 1 | 2.3 | 22 |
| SLC27A2 | Solute carrier family 27 member 2 | 2.3 | 6 |
| SLC17A1 | Solute carrier family 17 member 1 | 2.3 | 0 |
| DHODH | Dihydroorotate dehydrogenase (quinone) | 2.3 | 6 |
| RHOA | Ras homolog family member a | 2.3 | 2201 |
| TADA2B | Transcriptional adaptor 2b | 2.3 | 5 |
| AZIN1 | Antizyme inhibitor 1 | 2.3 | 7 |
| PHLPP1 | Ph domain and leucine rich repeat protein phosphatase 1 | 2.3 | 40 |
| LACTB2 | Lactamase beta 2 | 2.3 | 4 |
| SUPT20H | Spt20 homolog, saga complex component | 2.3 | 8 |
| XAGE3 | X antigen family member 3 | 2.2 | 2 |
| CRP | C-reactive protein | 2.2 | 157 |
| CELA1 | Chymotrypsin like elastase 1 | 2.2 | 3 |
| PDIA4 | Protein disulfide isomerase family a member 4 | 2.2 | 9 |
| RASA1 | Ras p21 protein activator 1 | 2.2 | 72 |
| SLC14A2 | Solute carrier family 14 member 2 | 2.2 | 3 |
| ZNF397 | Zinc finger protein 397 | 2.2 | 3 |
| FAR1 | Fatty acyl-coa reductase 1 | 2.2 | 2 |
| ABHD11 | Abhydrolase domain containing 11 | 2.2 | 25 |
| NUDT7 | Nudix hydrolase 7 | 2.2 | 0 |
| KHDC4 | Kh domain containing 4, pre-mrna splicing factor | 2.2 | 5 |
| GPA33 | Glycoprotein a33 | 2.2 | 9 |
| ZNF768 | Zinc finger protein 768 | 2.2 | 4 |
| HSPA6 | Heat shock protein family a (hsp70) member 6 | 2.2 | 8 |
| MBD2 | Methyl-cpg binding domain protein 2 | 2.2 | 33 |
| ULK3 | Unc-51 like kinase 3 | 2.2 | 10 |
| PEX7 | Peroxisomal biogenesis factor 7 | 2.2 | 5 |
| ATP10D | Atpase phospholipid transporting 10d (putative) | 2.2 | 3 |
| CHI3L1 | Chitinase 3 like 1 | 2.2 | 40 |
| KRIT1 | Krit1 ankyrin repeat containing | 2.0 | 34 |
| TAF6L | Tata-box binding protein associated factor 6 like | 2.0 | 7 |
| H2AC20 | H2a clustered histone 20 | 2.0 | 5 |
| RNF138 | Ring finger protein 138 | 2.0 | 3 |
| TEK | Tek receptor tyrosine kinase | 2.0 | 175 |
| ASZ1 | Ankyrin repeat, sam and basic leucine zipper domain containing 1 | 2.0 | 5 |
| SRXN1 | Sulfiredoxin 1 | 2.0 | 4 |
| ACD | Acd shelterin complex subunit and telomerase recruitment factor | 2.0 | 9 |
| FADS6 | Fatty acid desaturase 6 | 2.0 | 0 |
| MPZL1 | Myelin protein zero like 1 | 2.0 | 13 |
| GOLGA6B | Golgin a6 family member b | 2.0 | 0 |
| MST1 | Macrophage stimulating 1 | 2.0 | 95 |
| RGS18 | Regulator of g protein signaling 18 | 2.0 | 5 |
| PYM1 | Pym homolog 1, exon junction complex associated factor | 2.0 | 5 |
| SLC20A1 | Solute carrier family 20 member 1 | 2.0 | 8 |
| MEF2C | Myocyte enhancer factor 2c | 2.0 | 53 |
| SPRED1 | Sprouty related evh1 domain containing 1 | 2.0 | 19 |
| ZNF800 | Zinc finger protein 800 | 2.0 | 4 |
| PIM2 | Pim-2 proto-oncogene, serine/threonine kinase | 2.0 | 14 |
| LIMK2 | Lim domain kinase 2 | 2.0 | 160 |
| TSPAN14 | Tetraspanin 14 | 2.0 | 3 |
| SLC35F2 | Solute carrier family 35 member f2 | 2.0 | 5 |
| RAB13 | Rab13, member ras oncogene family | 2.0 | 14 |
| FAM76B | Family with sequence similarity 76 member b | 2.0 | 4 |
| PDLIM1 | Pdz and lim domain 1 | 2.0 | 7 |
| MICOS10 | Mitochondrial contact site and cristae organizing system subunit 10 | 2.0 | 2 |
| PLIN3 | Perilipin 3 | 2.0 | 10 |
| RHOB | Ras homolog family member b | 2.0 | 289 |
| COX5B | Cytochrome c oxidase subunit 5b | 2.0 | 7 |
| SIGLEC11 | Sialic acid binding ig like lectin 11 | 2.0 | 4 |
| PTPRM | Protein tyrosine phosphatase receptor type m | 2.0 | 15 |
| POU2AF1 | Pou class 2 homeobox associating factor 1 | 2.0 | 6 |
| ARHGAP45 | Rho gtpase activating protein 45 | 2.0 | 15 |
| IGFLR1 | Igf like family receptor 1 | 2.0 | 1 |
| H3C10 | H3 clustered histone 10 | 2.0 | 2 |
| KIF16B | Kinesin family member 16b | 2.0 | 7 |
This table shows the genes with the strongest correlations between dependency scores. The ‘co-publication count’ column attempts to quantify the co-occurance of ROCK1 and a gene that shows a strong co-essentiality. With this value, positive controls (i.e. genes known to be related) can be easily found. Likewise, opportunities for discovery (i.e. functional relationships not yet described) can also be found. To view raw correlation values or a ‘co-publicaiton index’, navigate back to the dependency page on DDH.
4.3.4 Positive Enrichment
To identify clusters of genes with shared relationships, we performed gene set enrichment analysis. Enrichment analysis is a computational method for inferring knowledge about a target gene set by comparing it to annotated gene sets representing prior biological knowledge. Enrichment analysis determines whether an input set of genes significantly overlaps with annotated gene sets. For each gene in our matrix, we determined the number of genes that were greater than or less than 2 standard deviations away from the permuted mean. This target gene list was then queried across a broad range of curated data. By leveraging the Enrichr resource from the Ma’ayan Laboratory, we determined the top ranked pathways, processes, drugs, cell lines, tissues, or diseases, and ranked by p-value. In this setting, the p-value is computed using a standard statistical method used by most enrichment analysis tools: Fisher’s exact test or the hypergeometric test. This is a binomial proportion test that assumes a binomial distribution and independence for probability of any gene belonging to any set. See here for more information about how Enrichr computes its associations.
These 1 genes were queried for gene set enrichment, and the gene sets and pathways with the strongest statistical significance are shown. Simply stated, these are the pathways that best represent the list of genes that share similar genetic dependencies, and suggest that the query gene is part of these pathways.
| Gene Set | Gene List | Overlap | Adjusted p-value |
|---|---|---|---|
| DSigDB | CGP74514A LINCS | 10/125 | 2.37 × 10⁻⁶ |
| huMAP | TADA2B | 4/10 | 6.49 × 10⁻⁶ |
| Reactome 2016 | RHO GTPases Activate ROCKs Homo sapiens R-HSA-5627117 | 5/17 | 1.01 × 10⁻⁵ |
| DSigDB | R406 Kinome Scan | 11/203 | 1.07 × 10⁻⁵ |
| DSigDB | CEP-701 Kinome Scan | 12/272 | 1.51 × 10⁻⁵ |
| DSigDB | Crizotinib LINCS | 9/136 | 1.60 × 10⁻⁵ |
| DSigDB | Momelotinib LINCS | 7/65 | 1.60 × 10⁻⁵ |
| DSigDB | Crizotinib FDA | 9/138 | 1.60 × 10⁻⁵ |
| DSigDB | PHA-767491 LINCS | 8/101 | 1.69 × 10⁻⁵ |
| DSigDB | R406 LINCS | 10/194 | 1.84 × 10⁻⁵ |
| DSigDB | Crizotinib | 9/147 | 1.84 × 10⁻⁵ |
| DSigDB | BX-912 LINCS | 10/206 | 2.82 × 10⁻⁵ |
This table shows the top 12 pathways of genes that show similar co-essential profiles as ROCK1. To generate these pathways, gene set enrichment was performed on all genes in the co-essentiality table, and then ranked by p-value.
4.3.5 Negative Correlations
Like the analysis for genes that share similar patterns, this analysis can be used to find genes that share distinctly dissimilar patterns; that is, genes that have an inverse correlation of dependences. Simply stated, the cells that care about ROCK1 deletion do not care about deletion of these genes, implying an inverse or opposing relationship. In the Dependency Score Example heatmap schematic above, ROCK1 is gene X, and genes with dissimilar patterns would be genes D, E, and F. The genes that show inverse genetic dependencies to ROCK1 and are below 2 standard deviations away from the resampled mean are:
| Symbol | Gene Name | Z-score | Co-Publication Count |
|---|---|---|---|
| CYTH3 | Cytohesin 3 | -2.0 | 15 |
| PHACTR4 | Phosphatase and actin regulator 4 | -2.0 | 9 |
| NUP85 | Nucleoporin 85 | -2.0 | 6 |
| SPX | Spexin hormone | -2.0 | 2 |
| PRELID1 | Preli domain containing 1 | -2.0 | 3 |
| DHX38 | Deah-box helicase 38 | -2.0 | 6 |
| FAM32A | Family with sequence similarity 32 member a | -2.0 | 3 |
| IL36A | Interleukin 36 alpha | -2.0 | 9 |
| TXNL4B | Thioredoxin like 4b | -2.0 | 7 |
| GTF2H3 | General transcription factor iih subunit 3 | -2.0 | 8 |
| KRT18 | Keratin 18 | -2.0 | 74 |
| HTR3E | 5-Hydroxytryptamine receptor 3e | -2.0 | 3 |
| FAM83H | Family with sequence similarity 83 member h | -2.0 | 12 |
| IL5 | Interleukin 5 | -2.0 | 73 |
| NCAPH | Non-smc condensin i complex subunit h | -2.0 | 6 |
| PUS3 | Pseudouridine synthase 3 | -2.0 | 2 |
| TSEN2 | Trna splicing endonuclease subunit 2 | -2.0 | 4 |
| GTF2E2 | General transcription factor iie subunit 2 | -2.0 | 4 |
| CCT3 | Chaperonin containing tcp1 subunit 3 | -2.0 | 17 |
| TMEM258 | Transmembrane protein 258 | -2.0 | 5 |
| ACTB | Actin beta | -2.0 | 294 |
| SLC35B1 | Solute carrier family 35 member b1 | -2.0 | 1 |
| PSMD14 | Proteasome 26s subunit, non-atpase 14 | -2.0 | 9 |
| POLR1C | Rna polymerase i and iii subunit c | -2.0 | 8 |
| GLMN | Glomulin, fkbp associated protein | -2.0 | 3 |
| CLNS1A | Chloride nucleotide-sensitive channel 1a | -2.0 | 9 |
| TAX1BP3 | Tax1 binding protein 3 | -2.0 | 9 |
| BDKRB1 | Bradykinin receptor b1 | -2.0 | 10 |
| RAD17 | Rad17 checkpoint clamp loader component | -2.0 | 8 |
| AURKB | Aurora kinase b | -2.0 | 83 |
| TMED10 | Transmembrane p24 trafficking protein 10 | -2.0 | 8 |
| MSN | Moesin | -2.0 | 165 |
| URM1 | Ubiquitin related modifier 1 | -2.0 | 1 |
| WDR73 | Wd repeat domain 73 | -2.0 | 2 |
| CSNK1A1 | Casein kinase 1 alpha 1 | -2.0 | 27 |
| C1D | C1d nuclear receptor corepressor | -2.0 | 5 |
| PPP1CA | Protein phosphatase 1 catalytic subunit alpha | -2.0 | 45 |
| BCAR1 | Bcar1 scaffold protein, cas family member | -2.0 | 115 |
| CHMP3 | Charged multivesicular body protein 3 | -2.0 | 11 |
| CWC22 | Cwc22 spliceosome associated protein homolog | -2.0 | 9 |
| UBE2L3 | Ubiquitin conjugating enzyme e2 l3 | -2.0 | 12 |
| UBE2I | Ubiquitin conjugating enzyme e2 i | -2.0 | 24 |
| RPL3 | Ribosomal protein l3 | -2.0 | 13 |
| AGAP6 | Arfgap with gtpase domain, ankyrin repeat and ph domain 6 | -2.0 | 0 |
| DYNC1H1 | Dynein cytoplasmic 1 heavy chain 1 | -2.0 | 14 |
| SFXN2 | Sideroflexin 2 | -2.0 | 3 |
| KIAA1755 | Kiaa1755 | -2.0 | 2 |
| FNDC3B | Fibronectin type iii domain containing 3b | -2.0 | 21 |
| SEC61G | Sec61 translocon subunit gamma | -2.0 | 4 |
| RCC1 | Regulator of chromosome condensation 1 | -2.0 | 17 |
| ELOC | Elongin c | -2.0 | 15 |
| PTPN1 | Protein tyrosine phosphatase non-receptor type 1 | -2.0 | 77 |
| TIGD3 | Tigger transposable element derived 3 | -2.0 | 1 |
| ELAVL4 | Elav like rna binding protein 4 | -2.0 | 6 |
| ZCCHC9 | Zinc finger cchc-type containing 9 | -2.0 | 4 |
| MDH1 | Malate dehydrogenase 1 | -2.0 | 11 |
| SPANXN1 | Spanx family member n1 | -2.0 | 0 |
| NPM1 | Nucleophosmin 1 | -2.0 | 93 |
| PLAAT4 | Phospholipase a and acyltransferase 4 | -2.0 | 9 |
| GNL3 | G protein nucleolar 3 | -2.0 | 11 |
| NUP35 | Nucleoporin 35 | -2.0 | 4 |
| IRGC | Immunity related gtpase cinema | -2.0 | 1 |
| SRPK3 | Srsf protein kinase 3 | -2.2 | 2 |
| PRMT1 | Protein arginine methyltransferase 1 | -2.2 | 42 |
| RPS15 | Ribosomal protein s15 | -2.2 | 18 |
| C11orf16 | Chromosome 11 open reading frame 16 | -2.2 | 0 |
| ORC3 | Origin recognition complex subunit 3 | -2.2 | 4 |
| RIPK3 | Receptor interacting serine/threonine kinase 3 | -2.2 | 56 |
| CDIPT | Cdp-diacylglycerol--inositol 3-phosphatidyltransferase | -2.2 | 8 |
| ACSF2 | Acyl-coa synthetase family member 2 | -2.2 | 3 |
| CFLAR | Casp8 and fadd like apoptosis regulator | -2.2 | 59 |
| SMU1 | Smu1 dna replication regulator and spliceosomal factor | -2.2 | 5 |
| SERPINC1 | Serpin family c member 1 | -2.2 | 21 |
| VCL | Vinculin | -2.2 | 290 |
| ETF1 | Eukaryotic translation termination factor 1 | -2.2 | 6 |
| UTP18 | Utp18 small subunit processome component | -2.2 | 7 |
| ELP3 | Elongator acetyltransferase complex subunit 3 | -2.2 | 6 |
| WDR12 | Wd repeat domain 12 | -2.2 | 5 |
| IARS1 | Isoleucyl-trna synthetase 1 | -2.2 | 24 |
| KARS1 | Lysyl-trna synthetase 1 | -2.2 | 9 |
| BRAT1 | Brca1 associated atm activator 1 | -2.2 | 3 |
| NUP160 | Nucleoporin 160 | -2.2 | 6 |
| VAMP5 | Vesicle associated membrane protein 5 | -2.2 | 1 |
| TOM1L2 | Target of myb1 like 2 membrane trafficking protein | -2.2 | 2 |
| FAAH | Fatty acid amide hydrolase | -2.2 | 6 |
| TCOF1 | Treacle ribosome biogenesis factor 1 | -2.2 | 9 |
| NEDD8 | Nedd8 ubiquitin like modifier | -2.2 | 19 |
| TOP1 | Dna topoisomerase i | -2.2 | 16 |
| RPP38 | Ribonuclease p/mrp subunit p38 | -2.2 | 3 |
| DCTN4 | Dynactin subunit 4 | -2.2 | 13 |
| TRH | Thyrotropin releasing hormone | -2.2 | 5 |
| TRIM62 | Tripartite motif containing 62 | -2.2 | 3 |
| NAA50 | N-alpha-acetyltransferase 50, nate catalytic subunit | -2.2 | 10 |
| TANGO6 | Transport and golgi organization 6 homolog | -2.2 | 2 |
| PTPRK | Protein tyrosine phosphatase receptor type k | -2.2 | 13 |
| RTRAF | Rna transcription, translation and transport factor | -2.2 | 5 |
| C1orf87 | Chromosome 1 open reading frame 87 | -2.2 | 2 |
| RASSF8 | Ras association domain family member 8 | -2.2 | 10 |
| YBX3 | Y-box binding protein 3 | -2.2 | 21 |
| PPP2R1A | Protein phosphatase 2 scaffold subunit aalpha | -2.2 | 33 |
| PREB | Prolactin regulatory element binding | -2.2 | 4 |
| PPP1CB | Protein phosphatase 1 catalytic subunit beta | -2.2 | 39 |
| TRAPPC3 | Trafficking protein particle complex subunit 3 | -2.2 | 6 |
| SYT14 | Synaptotagmin 14 | -2.2 | 1 |
| WDR3 | Wd repeat domain 3 | -2.2 | 4 |
| TUBG1 | Tubulin gamma 1 | -2.2 | 12 |
| PDLIM7 | Pdz and lim domain 7 | -2.2 | 54 |
| CDC6 | Cell division cycle 6 | -2.2 | 38 |
| CKAP5 | Cytoskeleton associated protein 5 | -2.2 | 14 |
| MTOR | Mechanistic target of rapamycin kinase | -2.2 | 1314 |
| RBM14 | Rna binding motif protein 14 | -2.2 | 8 |
| INTS1 | Integrator complex subunit 1 | -2.2 | 4 |
| PCDHA5 | Protocadherin alpha 5 | -2.2 | 1 |
| RTCB | Rna 2',3'-cyclic phosphate and 5'-oh ligase | -2.2 | 10 |
| USP36 | Ubiquitin specific peptidase 36 | -2.2 | 13 |
| ALG11 | Alg11 alpha-1,2-mannosyltransferase | -2.2 | 3 |
| RNH1 | Ribonuclease/angiogenin inhibitor 1 | -2.2 | 7 |
| ADAM11 | Adam metallopeptidase domain 11 | -2.2 | 7 |
| GAB1 | Grb2 associated binding protein 1 | -2.2 | 62 |
| CCDC152 | Coiled-coil domain containing 152 | -2.2 | 0 |
| IGFL1 | Igf like family member 1 | -2.2 | 0 |
| MRE11 | Mre11 homolog, double strand break repair nuclease | -2.2 | 25 |
| EIF2B3 | Eukaryotic translation initiation factor 2b subunit gamma | -2.2 | 5 |
| CTU1 | Cytosolic thiouridylase subunit 1 | -2.3 | 3 |
| NTMT1 | N-terminal xaa-pro-lys n-methyltransferase 1 | -2.3 | 6 |
| PALD1 | Phosphatase domain containing paladin 1 | -2.3 | 4 |
| RPTOR | Regulatory associated protein of mtor complex 1 | -2.3 | 61 |
| SPANXN3 | Spanx family member n3 | -2.3 | 4 |
| PSMA2 | Proteasome 20s subunit alpha 2 | -2.3 | 8 |
| SEC13 | Sec13 homolog, nuclear pore and copii coat complex component | -2.3 | 10 |
| ATR | Atr serine/threonine kinase | -2.3 | 103 |
| SSR4 | Signal sequence receptor subunit 4 | -2.3 | 2 |
| DNAH6 | Dynein axonemal heavy chain 6 | -2.3 | 1 |
| ZNF131 | Zinc finger protein 131 | -2.3 | 5 |
| BNIP1 | Bcl2 interacting protein 1 | -2.3 | 7 |
| EXTL3 | Exostosin like glycosyltransferase 3 | -2.3 | 7 |
| RDH11 | Retinol dehydrogenase 11 | -2.3 | 4 |
| ANAPC1 | Anaphase promoting complex subunit 1 | -2.3 | 10 |
| SFTPA1 | Surfactant protein a1 | -2.3 | 27 |
| CRKL | Crk like proto-oncogene, adaptor protein | -2.3 | 49 |
| RAP1B | Rap1b, member of ras oncogene family | -2.3 | 59 |
| RPL18 | Ribosomal protein l18 | -2.3 | 6 |
| RABGGTB | Rab geranylgeranyltransferase subunit beta | -2.3 | 7 |
| DDX54 | Dead-box helicase 54 | -2.3 | 7 |
| RBMX2 | Rna binding motif protein x-linked 2 | -2.3 | 4 |
| GIMAP1 | Gtpase, imap family member 1 | -2.3 | 1 |
| PSMC4 | Proteasome 26s subunit, atpase 4 | -2.3 | 13 |
| NUF2 | Nuf2 component of ndc80 kinetochore complex | -2.3 | 11 |
| NCAPH2 | Non-smc condensin ii complex subunit h2 | -2.3 | 5 |
| SYMPK | Symplekin | -2.3 | 5 |
| GPN1 | Gpn-loop gtpase 1 | -2.3 | 5 |
| RPF2 | Ribosome production factor 2 homolog | -2.3 | 5 |
| NDST1 | N-deacetylase and n-sulfotransferase 1 | -2.3 | 8 |
| AMER3 | Apc membrane recruitment protein 3 | -2.3 | 1 |
| PRKCI | Protein kinase c iota | -2.3 | 43 |
| TLN1 | Talin 1 | -2.3 | 60 |
| ALG1 | Alg1 chitobiosyldiphosphodolichol beta-mannosyltransferase | -2.3 | 3 |
| LSM8 | Lsm8 homolog, u6 small nuclear rna associated | -2.3 | 4 |
| EGFR | Epidermal growth factor receptor | -2.3 | 1287 |
| PSMA4 | Proteasome 20s subunit alpha 4 | -2.3 | 11 |
| EAF1 | Ell associated factor 1 | -2.3 | 3 |
| BCAR3 | Bcar3 adaptor protein, nsp family member | -2.3 | 10 |
| ALG14 | Alg14 udp-n-acetylglucosaminyltransferase subunit | -2.3 | 3 |
| NACA | Nascent polypeptide associated complex subunit alpha | -2.3 | 8 |
| ELP2 | Elongator acetyltransferase complex subunit 2 | -2.3 | 5 |
| MTREX | Mtr4 exosome rna helicase | -2.3 | 8 |
| PXN | Paxillin | -2.4 | 233 |
| LARP7 | La ribonucleoprotein 7, transcriptional regulator | -2.4 | 6 |
| RHEB | Ras homolog, mtorc1 binding | -2.4 | 57 |
| TAF2 | Tata-box binding protein associated factor 2 | -2.4 | 4 |
| CTDNEP1 | Ctd nuclear envelope phosphatase 1 | -2.4 | 5 |
| LCE1B | Late cornified envelope 1b | -2.4 | 3 |
| HSPA9 | Heat shock protein family a (hsp70) member 9 | -2.4 | 27 |
| SKP1 | S-phase kinase associated protein 1 | -2.4 | 43 |
| INTS9 | Integrator complex subunit 9 | -2.4 | 1 |
| EML3 | Emap like 3 | -2.4 | 3 |
| LASP1 | Lim and sh3 protein 1 | -2.4 | 51 |
| TMEM203 | Transmembrane protein 203 | -2.4 | 1 |
| CHMP7 | Charged multivesicular body protein 7 | -2.4 | 2 |
| ABCA4 | Atp binding cassette subfamily a member 4 | -2.4 | 21 |
| POLR1A | Rna polymerase i subunit a | -2.4 | 9 |
| ALG6 | Alg6 alpha-1,3-glucosyltransferase | -2.4 | 2 |
| POLR3A | Rna polymerase iii subunit a | -2.4 | 7 |
| KRT1 | Keratin 1 | -2.4 | 24 |
| UTP14A | Utp14a small subunit processome component | -2.4 | 3 |
| SAMD9 | Sterile alpha motif domain containing 9 | -2.4 | 5 |
| PGGT1B | Protein geranylgeranyltransferase type i subunit beta | -2.4 | 19 |
| DHDDS | Dehydrodolichyl diphosphate synthase subunit | -2.4 | 3 |
| PPIE | Peptidylprolyl isomerase e | -2.4 | 6 |
| ELN | Elastin | -2.4 | 117 |
| METTL16 | Methyltransferase like 16 | -2.4 | 9 |
| DDOST | Dolichyl-diphosphooligosaccharide--protein glycosyltransferase non-catalytic subunit | -2.4 | 9 |
| B3GAT3 | Beta-1,3-glucuronyltransferase 3 | -2.4 | 4 |
| MCM6 | Minichromosome maintenance complex component 6 | -2.4 | 26 |
| SDAD1 | Sda1 domain containing 1 | -2.4 | 7 |
| TLR7 | Toll like receptor 7 | -2.4 | 56 |
| CARS1 | Cysteinyl-trna synthetase 1 | -2.4 | 7 |
| GINS4 | Gins complex subunit 4 | -2.4 | 7 |
| OTOG | Otogelin | -2.4 | 0 |
| LRRC32 | Leucine rich repeat containing 32 | -2.4 | 9 |
| TRNT1 | Trna nucleotidyl transferase 1 | -2.4 | 2 |
| JUN | Jun proto-oncogene, ap-1 transcription factor subunit | -2.4 | 325 |
| UBA6 | Ubiquitin like modifier activating enzyme 6 | -2.4 | 10 |
| NIPAL3 | Nipa like domain containing 3 | -2.4 | 2 |
| ARHGEF7 | Rho guanine nucleotide exchange factor 7 | -2.4 | 58 |
| IMP4 | Imp u3 small nucleolar ribonucleoprotein 4 | -2.4 | 4 |
| CENPL | Centromere protein l | -2.4 | 5 |
| GRB2 | Growth factor receptor bound protein 2 | -2.4 | 151 |
| METTL14 | Methyltransferase like 14 | -2.4 | 18 |
| COPS4 | Cop9 signalosome subunit 4 | -2.4 | 7 |
| DYNLRB1 | Dynein light chain roadblock-type 1 | -2.4 | 3 |
| RNF25 | Ring finger protein 25 | -2.4 | 2 |
| COPS3 | Cop9 signalosome subunit 3 | -2.4 | 10 |
| ARHGAP10 | Rho gtpase activating protein 10 | -2.4 | 22 |
| ACTR3 | Actin related protein 3 | -2.4 | 157 |
| SF1 | Splicing factor 1 | -2.4 | 13 |
| C1QL2 | Complement c1q like 2 | -2.4 | 0 |
| POLR3F | Rna polymerase iii subunit f | -2.4 | 4 |
| OXER1 | Oxoeicosanoid receptor 1 | -2.4 | 1 |
| HAUS2 | Haus augmin like complex subunit 2 | -2.5 | 7 |
| C7 | Complement c7 | -2.5 | 7 |
| WDR33 | Wd repeat domain 33 | -2.5 | 6 |
| LIN52 | Lin-52 dream muvb core complex component | -2.5 | 4 |
| LEMD2 | Lem domain nuclear envelope protein 2 | -2.5 | 3 |
| ATP6V1C1 | Atpase h+ transporting v1 subunit c1 | -2.5 | 9 |
| CABP5 | Calcium binding protein 5 | -2.5 | 2 |
| NDOR1 | Nadph dependent diflavin oxidoreductase 1 | -2.5 | 4 |
| FCHO2 | Fch and mu domain containing endocytic adaptor 2 | -2.5 | 4 |
| VEZT | Vezatin, adherens junctions transmembrane protein | -2.5 | 4 |
| SLC39A11 | Solute carrier family 39 member 11 | -2.5 | 6 |
| BPIFA2 | Bpi fold containing family a member 2 | -2.5 | 4 |
| RASGRP2 | Ras guanyl releasing protein 2 | -2.5 | 7 |
| CCT8 | Chaperonin containing tcp1 subunit 8 | -2.5 | 11 |
| MIS12 | Mis12 kinetochore complex component | -2.5 | 5 |
| CPSF3 | Cleavage and polyadenylation specific factor 3 | -2.5 | 7 |
| HARS1 | Histidyl-trna synthetase 1 | -2.5 | 6 |
| UBA52 | Ubiquitin a-52 residue ribosomal protein fusion product 1 | -2.5 | 9 |
| SNRPD1 | Small nuclear ribonucleoprotein d1 polypeptide | -2.5 | 11 |
| GABRA1 | Gamma-aminobutyric acid type a receptor subunit alpha1 | -2.5 | 4 |
| ZNF594 | Zinc finger protein 594 | -2.5 | 0 |
| ITGB1 | Integrin subunit beta 1 | -2.5 | 484 |
| SPRTN | Sprt-like n-terminal domain | -2.5 | 7 |
| USP39 | Ubiquitin specific peptidase 39 | -2.5 | 4 |
| TUBA1C | Tubulin alpha 1c | -2.5 | 15 |
| MARK2 | Microtubule affinity regulating kinase 2 | -2.5 | 23 |
| PES1 | Pescadillo ribosomal biogenesis factor 1 | -2.5 | 11 |
| OR1J4 | Olfactory receptor family 1 subfamily j member 4 | -2.6 | 1 |
| ORC5 | Origin recognition complex subunit 5 | -2.6 | 5 |
| CENPN | Centromere protein n | -2.6 | 5 |
| PSMB11 | Proteasome subunit beta 11 | -2.6 | 1 |
| SHLD2 | Shieldin complex subunit 2 | -2.6 | 2 |
| LSM10 | Lsm10, u7 small nuclear rna associated | -2.6 | 4 |
| UTP6 | Utp6 small subunit processome component | -2.6 | 7 |
| LARS1 | Leucyl-trna synthetase 1 | -2.6 | 6 |
| UBR4 | Ubiquitin protein ligase e3 component n-recognin 4 | -2.6 | 18 |
| HEBP1 | Heme binding protein 1 | -2.6 | 4 |
| ZFP36L1 | Zfp36 ring finger protein like 1 | -2.6 | 3 |
| ARR3 | Arrestin 3 | -2.6 | 12 |
| WWTR1 | Ww domain containing transcription regulator 1 | -2.6 | 35 |
| ALPI | Alkaline phosphatase, intestinal | -2.6 | 12 |
| GGPS1 | Geranylgeranyl diphosphate synthase 1 | -2.6 | 12 |
| TOE1 | Target of egr1, exonuclease | -2.6 | 3 |
| ABCE1 | Atp binding cassette subfamily e member 1 | -2.7 | 9 |
| TENT5C | Terminal nucleotidyltransferase 5c | -2.7 | 3 |
| SNF8 | Snf8 subunit of escrt-ii | -2.7 | 6 |
| SF3B6 | Splicing factor 3b subunit 6 | -2.7 | 3 |
| PPP1R7 | Protein phosphatase 1 regulatory subunit 7 | -2.7 | 9 |
| PPEF1 | Protein phosphatase with ef-hand domain 1 | -2.7 | 10 |
| MGST1 | Microsomal glutathione s-transferase 1 | -2.7 | 8 |
| SSB | Small rna binding exonuclease protection factor la | -2.7 | 13 |
| DDX20 | Dead-box helicase 20 | -2.7 | 12 |
| MAEA | Macrophage erythroblast attacher, e3 ubiquitin ligase | -2.7 | 5 |
| TTK | Ttk protein kinase | -2.7 | 29 |
| RSU1 | Ras suppressor protein 1 | -2.7 | 18 |
| TPRKB | Tp53rk binding protein | -2.7 | 5 |
| PIK3C3 | Phosphatidylinositol 3-kinase catalytic subunit type 3 | -2.7 | 79 |
| METAP1 | Methionyl aminopeptidase 1 | -2.7 | 5 |
| YARS1 | Tyrosyl-trna synthetase 1 | -2.7 | 7 |
| LIMS1 | Lim zinc finger domain containing 1 | -2.7 | 22 |
| UFC1 | Ubiquitin-fold modifier conjugating enzyme 1 | -2.7 | 10 |
| ARPC4 | Actin related protein 2/3 complex subunit 4 | -2.7 | 16 |
| FOSL1 | Fos like 1, ap-1 transcription factor subunit | -2.8 | 74 |
| NGDN | Neuroguidin | -2.8 | 5 |
| SMC6 | Structural maintenance of chromosomes 6 | -2.8 | 12 |
| EIF2B1 | Eukaryotic translation initiation factor 2b subunit alpha | -2.8 | 9 |
| LSM6 | Lsm6 homolog, u6 small nuclear rna and mrna degradation associated | -2.8 | 6 |
| MMS19 | Mms19 homolog, cytosolic iron-sulfur assembly component | -2.8 | 6 |
| TP53BP2 | Tumor protein p53 binding protein 2 | -2.8 | 25 |
| LSM5 | Lsm5 homolog, u6 small nuclear rna and mrna degradation associated | -2.8 | 9 |
| METAP2 | Methionyl aminopeptidase 2 | -2.8 | 6 |
| PYROXD1 | Pyridine nucleotide-disulphide oxidoreductase domain 1 | -2.8 | 2 |
| MAD2L1 | Mitotic arrest deficient 2 like 1 | -2.8 | 31 |
| PPP1R12C | Protein phosphatase 1 regulatory subunit 12c | -2.8 | 14 |
| SGO1 | Shugoshin 1 | -2.9 | 7 |
| POLR3B | Rna polymerase iii subunit b | -2.9 | 4 |
| TIMM9 | Translocase of inner mitochondrial membrane 9 | -2.9 | 1 |
| ARHGAP29 | Rho gtpase activating protein 29 | -2.9 | 18 |
| TEAD1 | Tea domain transcription factor 1 | -2.9 | 44 |
| ACTG1 | Actin gamma 1 | -3.0 | 32 |
| ANAPC10 | Anaphase promoting complex subunit 10 | -3.0 | 5 |
| DLG5 | Discs large maguk scaffold protein 5 | -3.0 | 12 |
| SRP68 | Signal recognition particle 68 | -3.0 | 7 |
| MYO9A | Myosin ixa | -3.1 | 17 |
| VRK1 | Vrk serine/threonine kinase 1 | -3.1 | 13 |
| PDCL3 | Phosducin like 3 | -3.1 | 5 |
| RARS1 | Arginyl-trna synthetase 1 | -3.1 | 6 |
| POLR1B | Rna polymerase i subunit b | -3.1 | 9 |
| ARPC2 | Actin related protein 2/3 complex subunit 2 | -3.1 | 24 |
| SPECC1L | Sperm antigen with calponin homology and coiled-coil domains 1 like | -3.3 | 5 |
| RAC1 | Rac family small gtpase 1 | -3.3 | 985 |
| OCM | Oncomodulin | -3.3 | 1 |
| NCKAP1 | Nck associated protein 1 | -3.4 | 18 |
| ILK | Integrin linked kinase | -3.6 | 140 |
| PSMB7 | Proteasome 20s subunit beta 7 | -3.7 | 9 |
| PKN2 | Protein kinase n2 | -3.7 | 62 |
| MOB4 | Mob family member 4, phocein | -3.8 | 5 |
| GUCY2F | Guanylate cyclase 2f, retinal | -3.8 | 3 |
| PPP1R12A | Protein phosphatase 1 regulatory subunit 12a | -4.0 | 309 |
| MPRIP | Myosin phosphatase rho interacting protein | -4.1 | 32 |
| NEURL4 | Neuralized e3 ubiquitin protein ligase 4 | -4.3 | 6 |
This table shows the genes with the strongest inverse correlations between dependency scores.
4.3.6 Negative Enrichment
These 1 genes were also queried for gene set enrichment, and the gene sets and pathways with the strongest statistical significance are shown. Simply stated, these are the pathways that best represent the list of genes that have inverse genetic dependencies.
| Gene Set | Gene List | Overlap | Adjusted p-value |
|---|---|---|---|
| HomoloGene | Eukaryota: Organisms with membrane bound nuclues and organelles | 110/2484 | 1.08 × 10⁻²³ |
| MGI Mammalian Phenotype Level 4 2019 | MP:0011100 preweaning lethality, complete penetrance | 81/1400 | 7.51 × 10⁻²² |
| Jensen TISSUES | BTO:0005453 | 204/7164 | 7.71 × 10⁻²² |
| Jensen COMPARTMENTS | Macromolecular complex | 154/4527 | 7.32 × 10⁻²¹ |
| ENCODE and ChEA Consensus TFs from ChIP-X | TAF1 ENCODE | 122/3346 | 2.28 × 10⁻¹⁸ |
| Jensen TISSUES | BTO:0004410 | 229/9290 | 1.12 × 10⁻¹⁷ |
| Jensen TISSUES | B-lymphocyte | 212/8270 | 1.73 × 10⁻¹⁷ |
| Jensen TISSUES | Cervical carcinoma cell | 152/4876 | 1.73 × 10⁻¹⁷ |
| Jensen TISSUES | Intestine | 159/5377 | 1.79 × 10⁻¹⁶ |
| Jensen TISSUES | Natural killer cell | 229/9530 | 1.79 × 10⁻¹⁶ |
| Jensen COMPARTMENTS | Protein complex | 129/3800 | 3.13 × 10⁻¹⁶ |
| Jensen TISSUES | Bronchial epithelial cell | 147/4837 | 7.91 × 10⁻¹⁶ |
This table shows the top 12 pathways of genes that show inverse co-essential profiles as ROCK1. To generate these pathways, gene set enrichment was performed on all genes in the co-essentiality table, and then ranked by p-value.
How to interpret these genes and pathways is more variable than the positively correlated genes and pathways. In some cases, a negative regulator of a gene has a negative correlation with that gene. In other cases, opposing pathways are shown, contrasting two opposing biological pathways.
4.4 Co-dependency Graph
As an alternative approach to prioritize further study of novel functional mappings, an interactive network graph of gene-gene relationships can be built. A single gene query results in a list of top and bottom associated genes based on patterns of gene dependency scores. The top 10 and bottom 10 genes are then queried for each of their top and bottom correlated genes. These resulting 400 gene pairs (20 genes * 20 genes) are then used to build a network graph, which can reveal if a top associated gene with the query gene, also has the query gene in its top (or bottom) 10. In this way, strong functional networks can be identified and prioritized for further study.
Identifying genes that share similar patterns of dependency to a queried unknown gene generates strong hypotheses about new functional annotations and maps to new pathways. However, the strength of the hypothesis cannot be fully inferred from single gene list. If a new gene is associated with the queried gene, then you might infer a functional relationship. However, if you inspect the top 10 genes with the queried gene, then inspect the top 10 genes of each of those, building a functional network graph of the top related genes might reveal a stronger association of the new gene with your queried gene and its top ranked genes.
make_legend(fun = “make_graph”)
This interactive network graph shows the top 10 genes with similar co-essientiality profiles as ROCK1, and then fetches each of their top 10. An edge connection is made between two genes when they each are present in the top 10 of eachothers’ list. This is a way for users to prioritize strong networks of functional relationships.