
2 Gene Expression
2.1 Subcellular Location
The cellanatogram plot shows the sub-cellular distribution of ROCK1 as reported by the human protein atlas (HPA) project.
2.2 Cell Line Expression
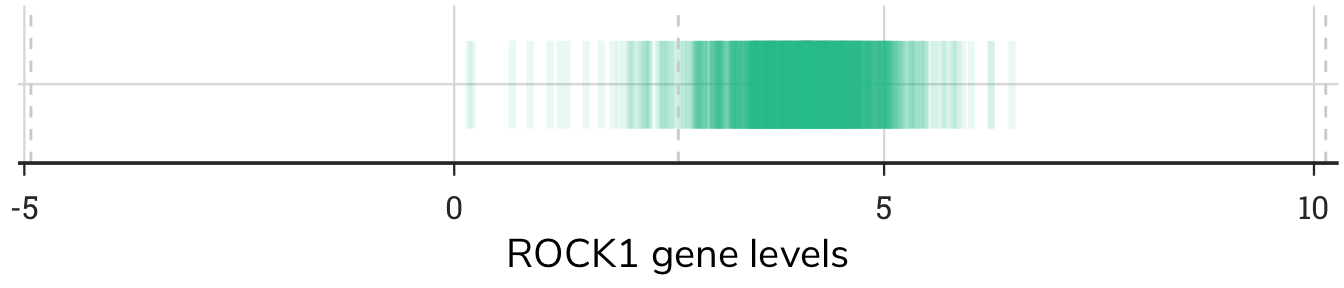
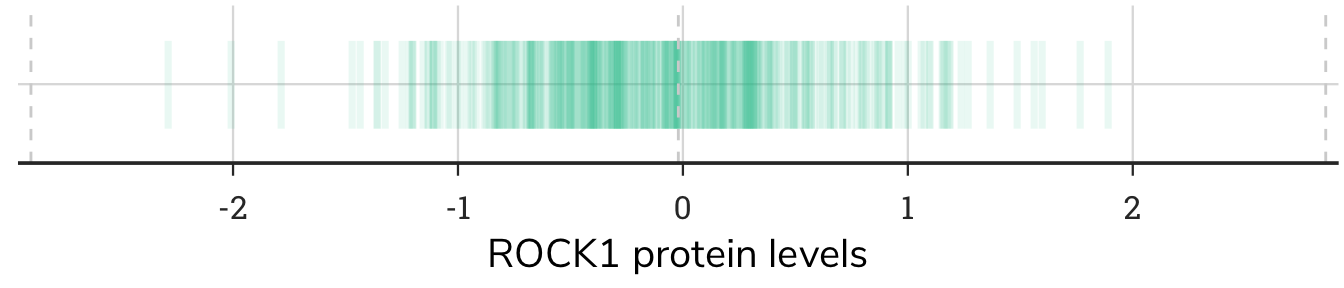
The cell expression plot shows the expression of ROCK1 across r length(unique(expression_long$gene)) cell lines from the cancer cell line encyclopedia (CCLE) project.
2.3 Tissue Distribution

The tissue anatogram plot shows the distribution of ROCK1 across the human body.